

Coastal Changes in Simeulue island, caused by the 2004 Earthquake
Emergence of Reefs: Coastal Change Inferred from Satellite Synthetic Aperture Radar Images (Canadian RADARSAT)Magnified Image of Northwestern Simeulue Island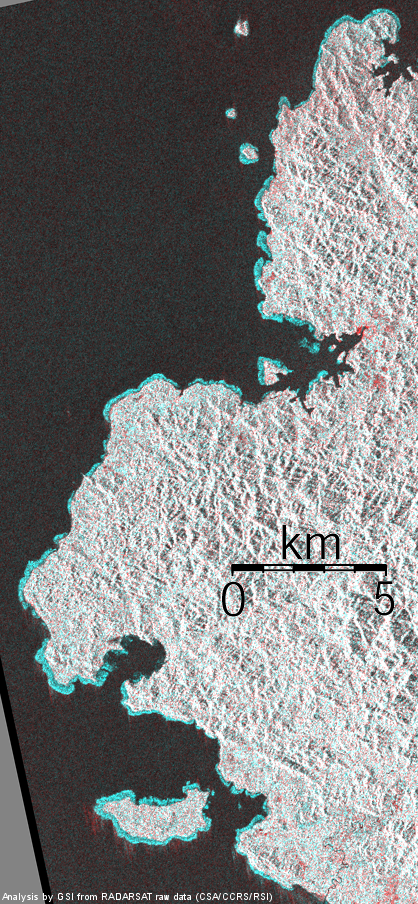
The image is derived from a comparison of intensity of reflected microwave
observed by Canadian RADARSAT satellite between July 22, 2003 (before Earthquake)
and February 17, 2005 (after Earthquake). An area colored in cyan is a
region where the reflective intensity is increased. The ribbons of cyan
are distributed along the west coast of northwestern part of Simeulue Island,
Indonesia. The image indicates emergence of reefs due to uplift caused
by a crustal deformation due to the 2004 Indian Ocean, M9 earthquake.
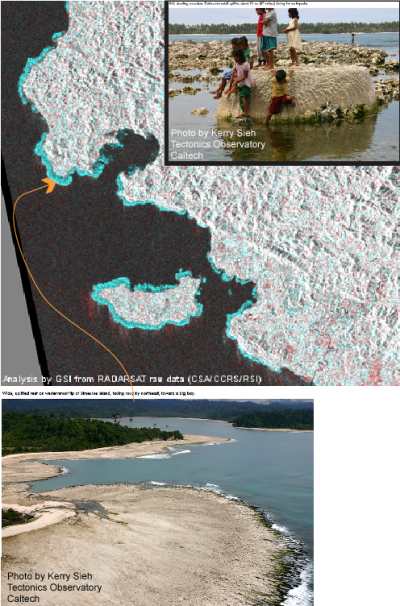
The width of the cyan ribbon is about 300m at maximum. The emergence had increased the size of small islets and even produced some new small islets. Tide level at the northwestern Simeulue -14.5cm and -1.5cm for the first and second image acquisition, respectively. About Radar ImagesRadar (SAR) images used for this study were acquired by Canadian RADARSAT. GSI requested to take the second, February 17, 2005, image. SAR image processing from the raw data to SLC, single-look-complex, image has been done by GSI with GAMMA software.
Region of Emergence Coast in Simeulue Island Seen in Satellite Radar Images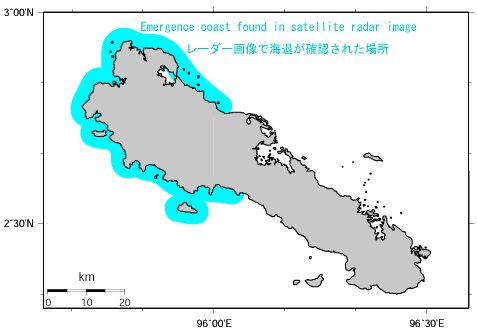
Whole Image of Simeulue IslandWhole high resolution image [PNG:12,453KB]
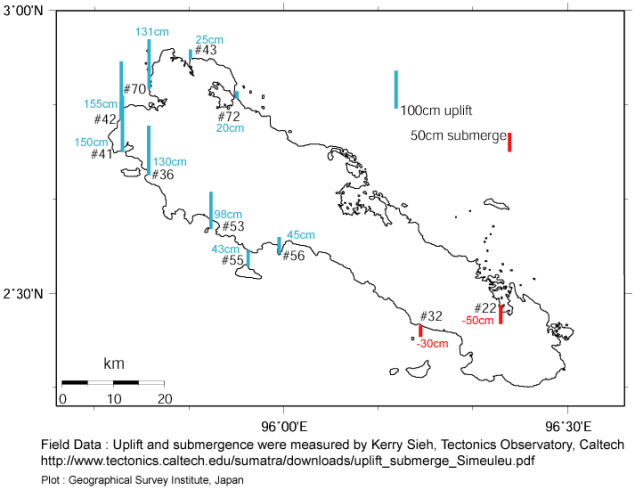
Dark, red or cyan region on the southeast land are due to wrong AGC, auto-gain-control, onboard. In spite of the problem, coastal change can be checked in southeast region. No coastal changes are seen in the southeast region from this image. Comparison with the Field Observation by Caltech Tectonics Observatory

| |||||||||||||||||||||||||

![Whole high resolution image [PNG:12,453KB]](/common/000040793.png)