

Bohol island, Philippines Earthquake: Crustal deformation detected by satellite SAR data
Crustal deformation observed by Synthetic Aperture Radar (SAR)Released: Nov. 8, 2013 Japanese version of this page Crustal DeformationA Mw7.1 (USGS) (Mw7.2: PHIVOLCS) earthquake occurred in Bohol island, Philippines on October 15, 2013. Applying an elaborated SAR image analysis (pixel offset method) using RADARSAT-2 data operated by Canadian Space Agency (CSA), we have successfully grasped the whole picture of the crustal deformation associated with the earthquake.
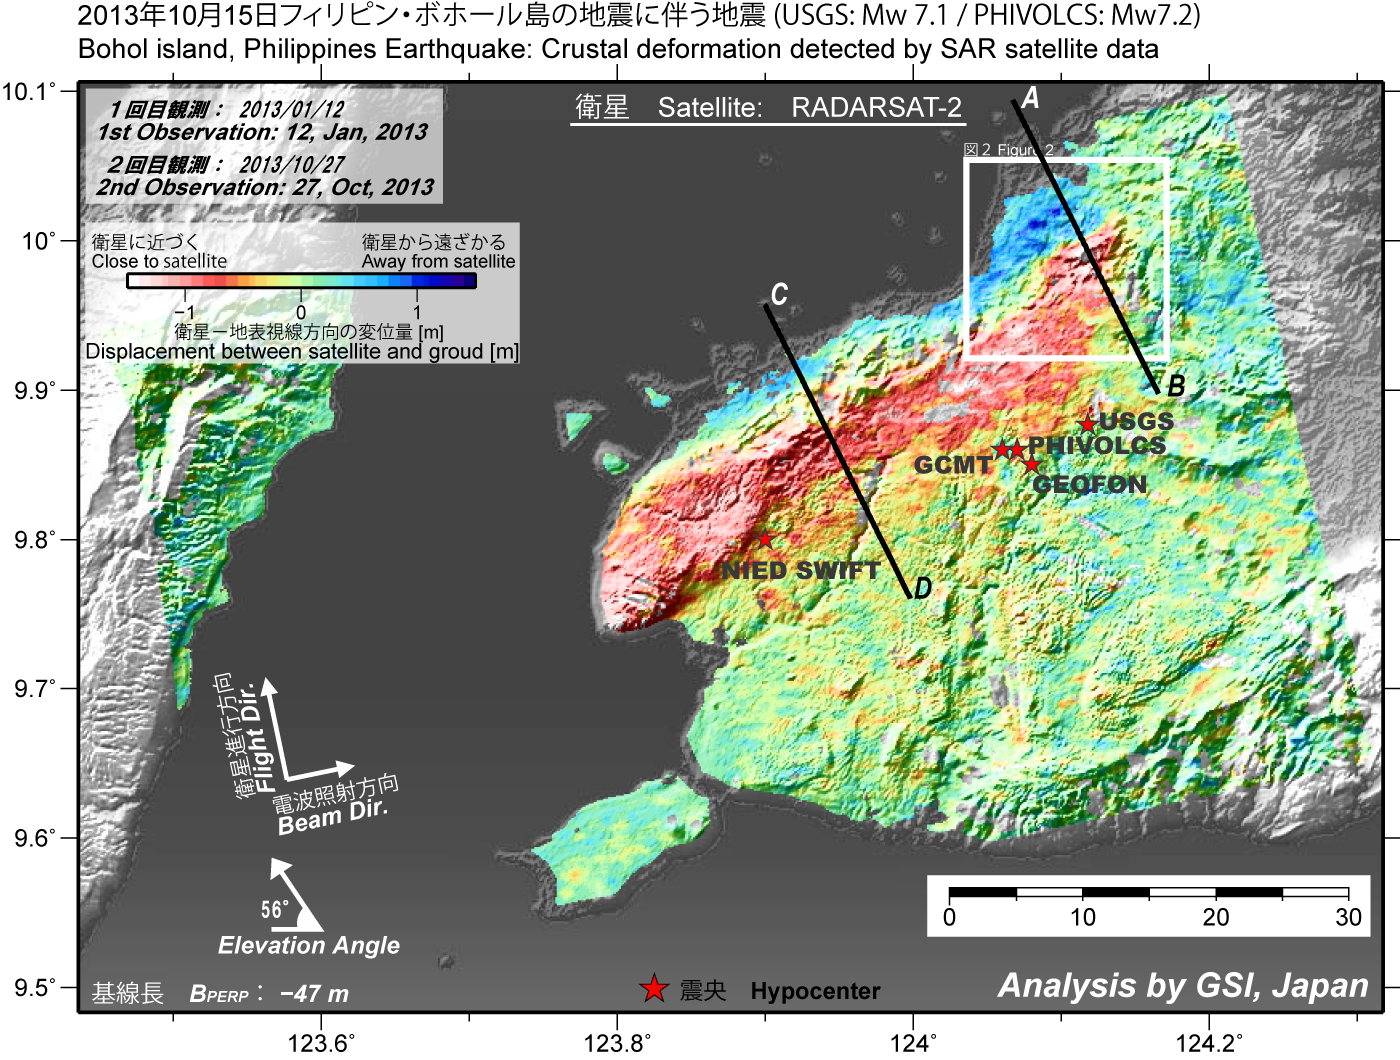 [PNG: 1.43MB] [PNG: 1.43MB]Figure 1. Red and blue-colored areas represent displacements toward and away from the satellite, respectively, which can be explained by uplift/westward movement and subsidence/eastward movement, respectively. The satellite used in this analysis illuminates microwave obliquely downward from the western sky. 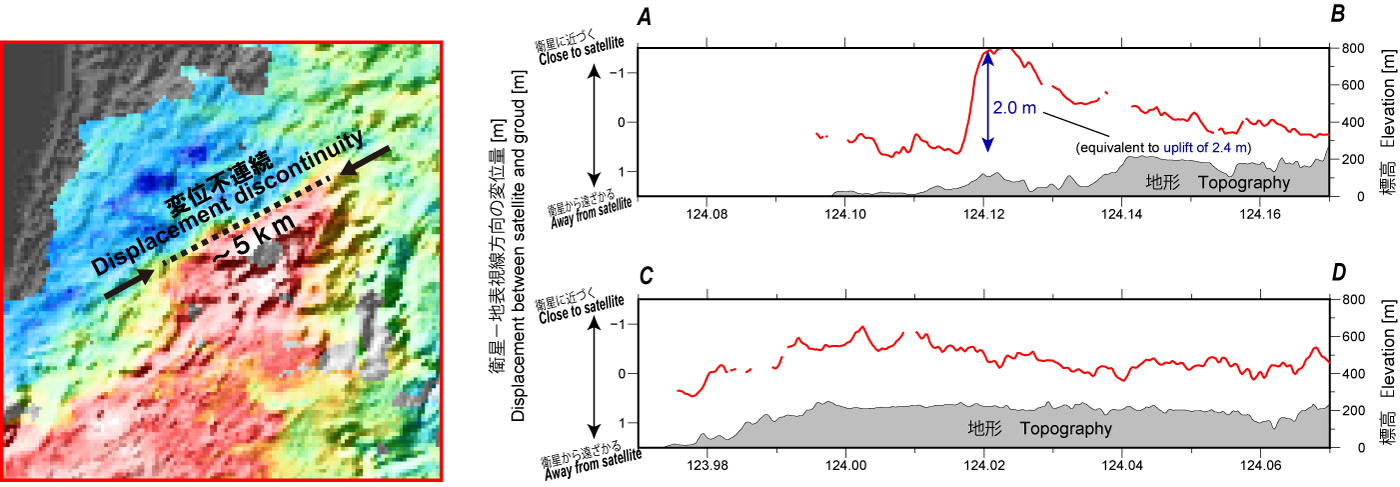 [PNG: 291KB] [PNG: 291KB]Figure 2. The left panel shows an enlarged view of the northeastern area (white frame of Figure 1). The right panels show displacement changes along the cross sections of A-B and C-D shown in Figure 1. A sharp large displacement change can be seen in the A-B cross section, suggesting a displacement offset due to the surface rupture. 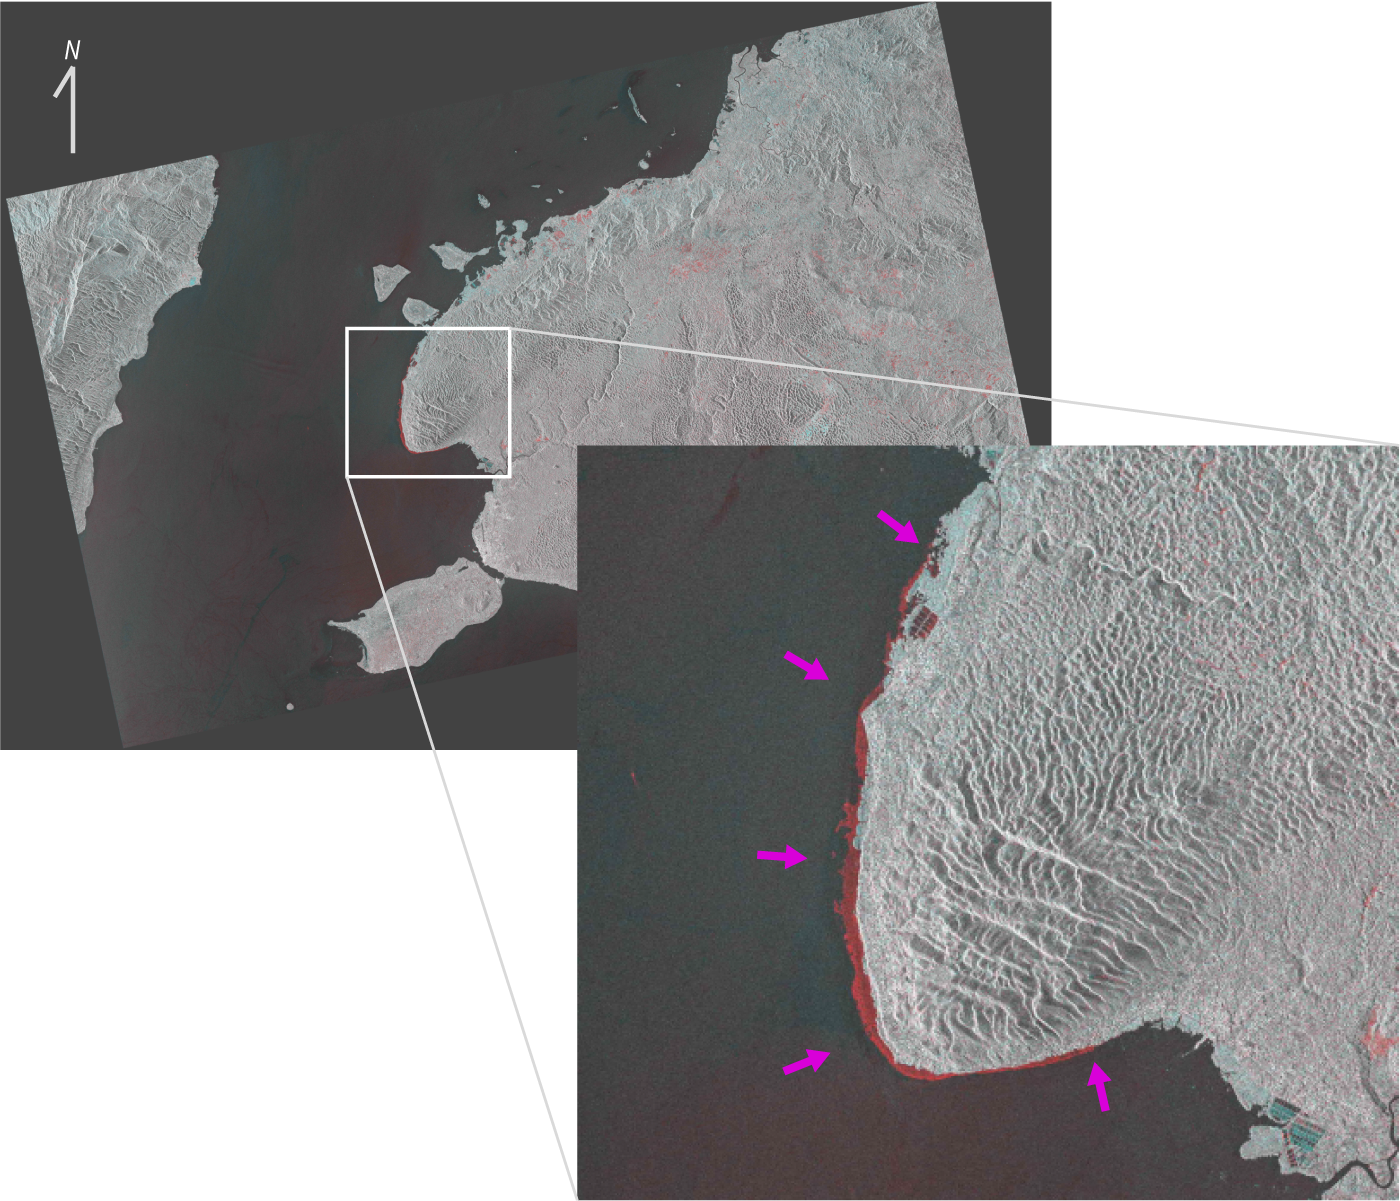 [PNG: 1.98MB] [PNG: 1.98MB]Figure 3. Shoreline changes derived by an additive color process Red- and cyan-colored areas represent emergence and submergence of the land (increase and decrease of the backscatter intensity), respectively. Bohol island, Philippines Earthquake
Satellite used in this analysisRADARSAT-2(CSA: Canadian Space Agency)
Paper, Report, PresentationKobayashi, T. (2014), Remarkable ground uplift and reverse fault ruptures for the 2013 Bohol earthquake (Mw 7.1), Philippines, revealed by SAR pixel offset analysis, Geoscience Letters, 1:7, doi:10.1186/2196-4092-1-7. [html] [PDF: 1.81MB]
ContactKOBAYASHI Tomokazu: Researcher
TOBITA Mikio: Principal Researcher   Some files are available in PDF format. To view PDF files, Adobe System's free "Adobe Reader" software must be installed. Please visit the following link to download the free software. |