Postseismic Slip Distribution Model Inferred from GEONET data
Postseismic Slip Distribution Model
We constructed a postseismic slip (afterslip) distribution model using surface displacement data observed by the GPS Earth Observation Network System (GEONET) for the 2011 off the Pacific coast of Tohoku Earthquake.
- Eastward displacements are observed along the Pacific coast from Aomori Prefecture to Chiba Prefecture.
- The observed postseismic displacement partly includes crustal deformation due to aftershocks.
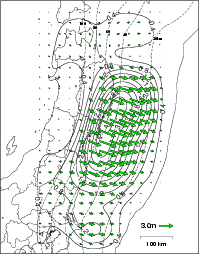
- A postseismic slip expands in and around the inferred coseismic slip area. In particular, relative large slips are estimated in the northwest and in the south (off Choshi) of the coseismic slip area.
Table. 1 Postseismic deformation and estimated slip
| Perioda |
Maximum
horizontal
displacement |
Estimated slip
(Maximum) |
Estimated slip
(southern local
maximum) |
Moment
magnitude
(Mw) |
| 2011-03-13 06:00 |
~12 cm b |
~37 cm |
~23 cm |
8.03 |
| 2011-03-14 03:00 |
~15 cm b |
~47 cm |
~27 cm |
8.10 |
| 2011-03-15 03:00 |
~18 cm b |
~55 cm |
~32 cm |
8.14 |
| 2011-03-16 09:00 |
~23 cm |
~66 cm |
~37 cm |
8.16 |
| 2011-03-18 03:00 |
~25 cm |
~73 cm |
~41 cm |
8.19 |
| 2011-03-22 03:00 |
~29 cm |
~87 cm |
~47 cm |
8.24 |
| 2011-03-25 03:00 |
~32 cm |
~97 cm |
~52 cm |
8.27 |
| 2011-03-31 03:00 |
~37 cm |
~108 cm |
~57 cm |
8.31 |
| 2011-04-07 03:00 |
~41 cm |
~123 cm |
~61 cm |
8.33 |
| 2011-04-14 03:00 |
~44 cm |
~136 cm |
~65 cm |
8.36 |
| 2011-04-21 03:00 |
~46 cm b |
~150 cm |
~69 cm |
8.38 |
| 2011-04-28 03:00 |
~49 cm |
~158 cm |
~74 cm |
8.39 |
| 2011-05-05 03:00 |
~51 cm |
~163 cm |
~74 cm |
8.42 |
| 2011-05-12 03:00 |
~53 cm |
~172 cm |
~77 cm |
8.42 |
| 2011-05-29 18:00 |
~57 cm |
~189 cm |
~84 cm |
8.44 |
| 2011-06-13 18:00 |
~61 cm |
~200 cm |
~87 cm |
8.46 |
| 2011-06-26 18:00 |
~63 cm |
~204 cm |
~89 cm |
8.48 |
| 2011-07-12 18:00 |
~65 cm |
~216 cm |
~90 cm |
8.48 |
| 2011-07-27 18:00 |
~68 cm |
~226 cm |
~94 cm |
8.50 |
| 2011-08-14 18:00 |
~70 cm |
~238 cm |
~99 cm |
8.51 |
| 2011-08-29 18:00 |
~72 cm |
~243 cm |
~99 cm |
8.52 |
| 2011-09-27 18:00 |
~76 cm |
~257 cm |
~102 cm |
8.53 |
| 2011-10-31 18:00 |
~79 cm |
~270 cm |
~104 cm |
8.55 |
| 2011-11-27 18:00 |
~81 cm |
~279 cm |
~106 cm |
8.56 |
| 2011-12-25 18:00 |
~84 cm |
~288 cm |
~107 cm |
8.57 |
| 2012-01-29 18:00 |
~86 cm |
~298 cm |
~110 cm |
8.57 |
| 2012-02-26 18:00 |
~88 cm |
~309 cm |
~111 cm |
8.58 |
| 2012-03-26 18:00 |
~89 cm |
~318 cm |
~112 cm |
8.59 |
| 2012-06-26 18:00 |
~96 cm |
~344 cm |
~118 cm |
8.61 |
| 2012-09-25 18:00 |
~101 cm |
~366 cm |
~121 cm |
8.62 |
| 2012-12-26 18:00 |
~105 cm |
~389 cm |
~121 cm |
8.64 |
| 2013-03-25 18:00 |
~109 cm |
~408 cm |
~124 cm |
8.65 |
a All periods start at 18:00, March 11, 2011 in Japan Standard Time (JST)
b The GPS data at which the maximum displacement was observed in most periods were not available for this period.
Notice:
- Update of this page is stopped in March, 2013 because a rate of postseismic deformation became small.
- This is a preliminary result. The analysis result is possibly updated with adding new data.
- We updated the models before April 4, 2011 with additional GPS data. (Updated on February 3, 2012)
The 2011 off the Pacific coast of Tohoku Earthquake
| Date-Time |
March 11, 2011 14:46 JST
March 11, 2011 05:46 UTC |
| Hypocenter Location |
38.103°N, 142.860°E, Depth: 24 km (JMA, as of March 13, 2011)
38.322°N, 142.369°E, Depth: 22.4 km (USGS, as of March 13, 2011) |
| Moment Magnitude |
9.0 (JMA, as of March 13, 2011)
9.0 (USGS, as of March 13, 2011) |
Copyrights and Credits
Copyright (C) Geospatial Information Authority of Japan, All rights Reserved.
We welcome links from your website to this website. When using materials on this website, we ask that proper credit be given.
Contact
HATANAKA Yuki : Director of Division (Crustal Deformation Research Division)
OZAWA Shinzaburo : Chief Researcher (Crustal Deformation Research Division)
NISHIMURA Takuya : Chief Researcher (Crustal Deformation Research Division)
SUITO Hisashi : Cheif Researcher (Crustal Deformation Research Division)
KOBAYASHI Tomokazu : Researcher (Crustal Deformation Research Division)

Some files are available in PDF format. To view PDF files, Adobe System's free "Adobe Reader" software must be installed. Please visit the following link to download the free software.


 [PDF: 106KB]
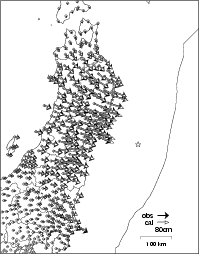 [PDF: 116KB]
 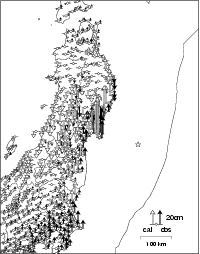 [PDF: 119KB]
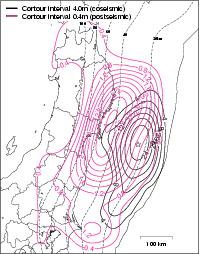 [PDF: 103KB]