Crustal Deformation Observed by Synthetic Aperture Radar (SAR)
Crustal Deformation revealed by InSAR
Large earthquakes successively occurred in central Italy on October 26 and 30, 2016. We applied interferometric analysis using ALOS-2/PALSAR-2 data to measure the crustal deformation caused by the earthquake.
The results obtained from the data are summarized as follows.
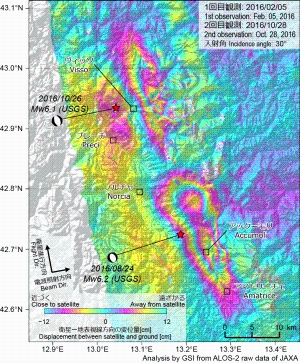
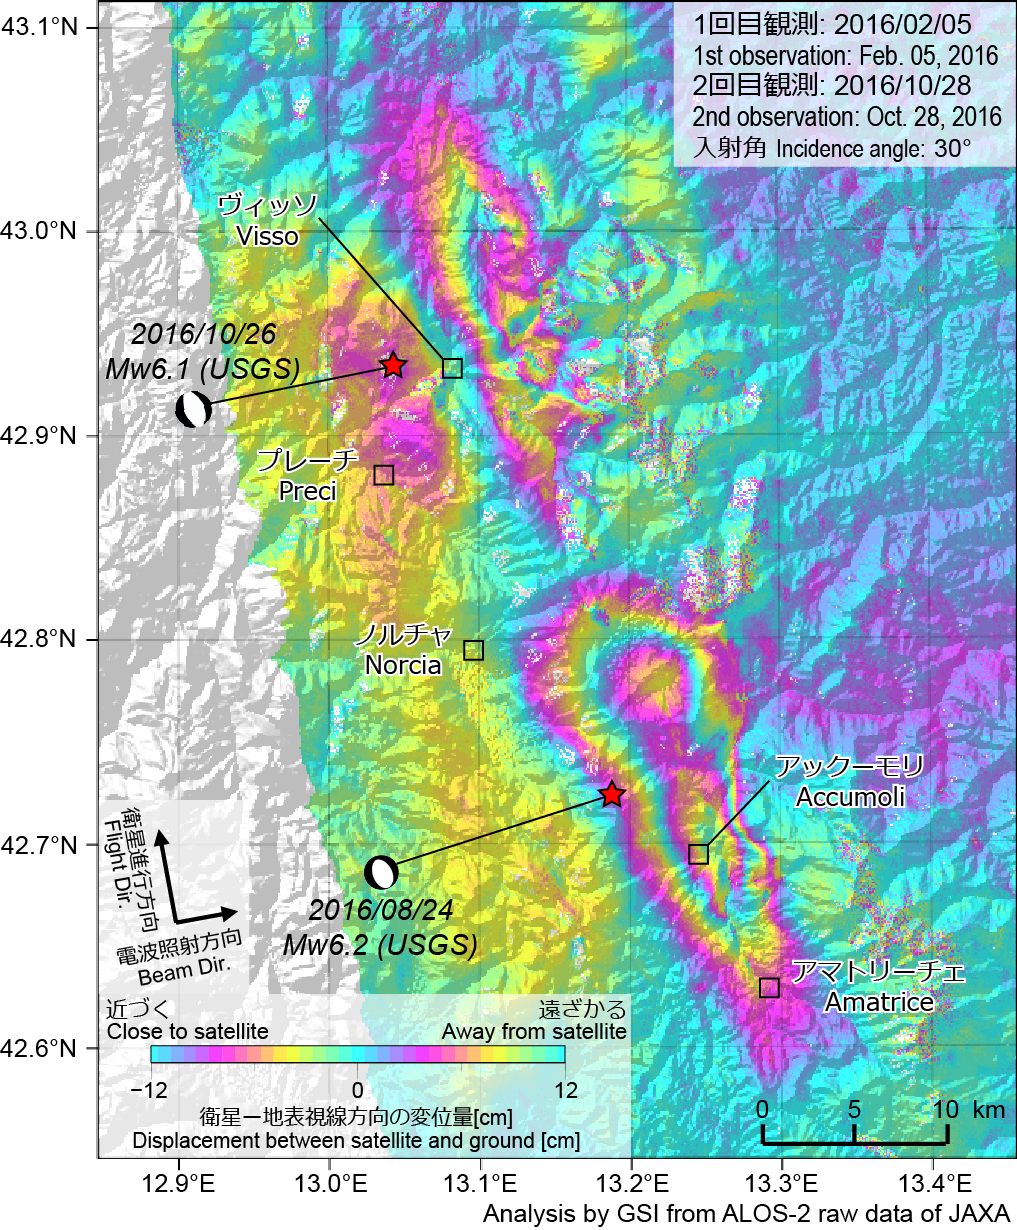
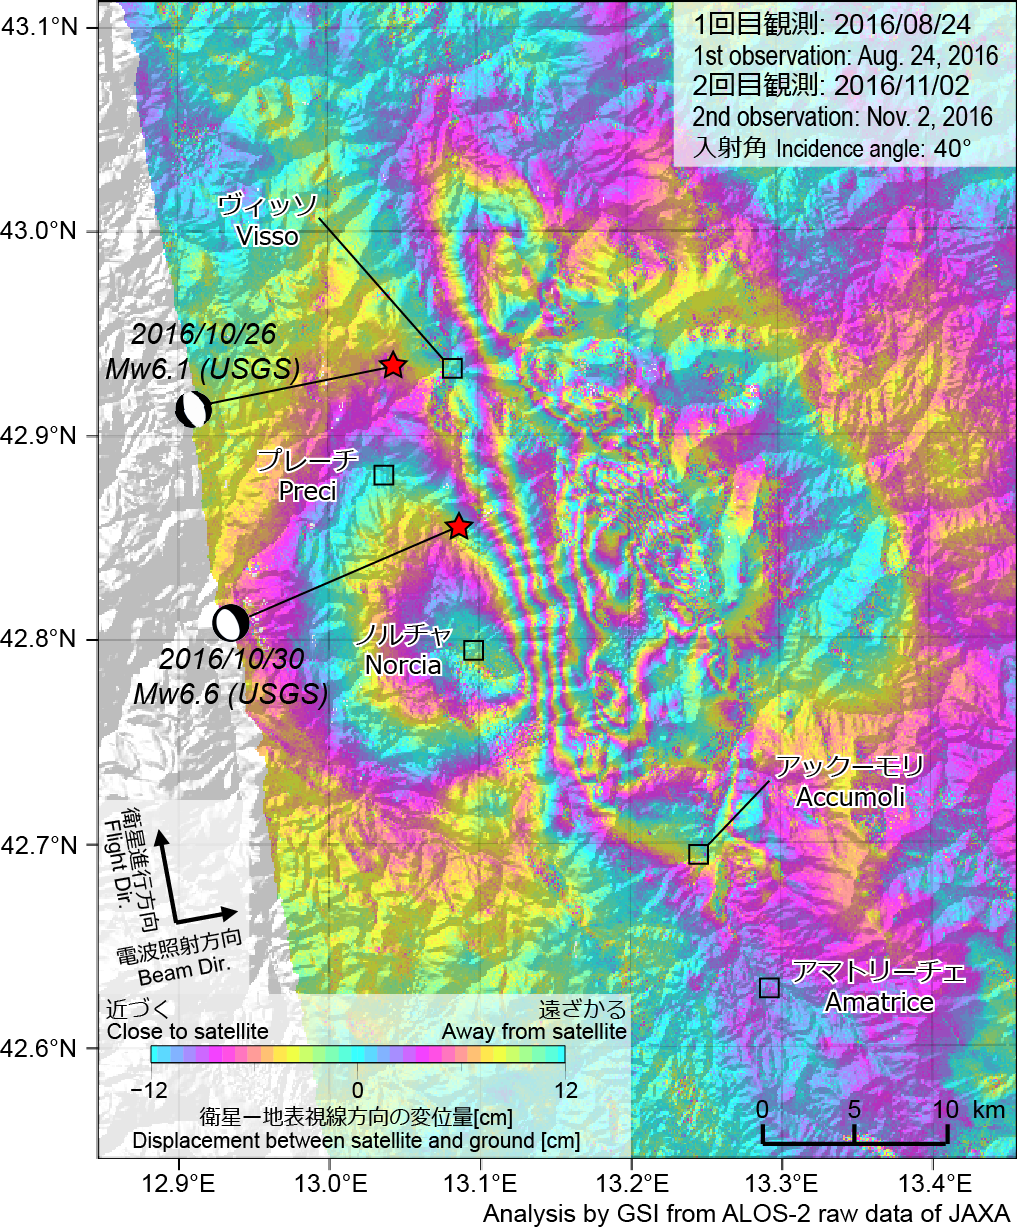
Mw 6.1 on October 26 (Fig. 1)
- The interferogram shows ~ 25 cm displacement away from the satellite around 7 km east from the epicenter.
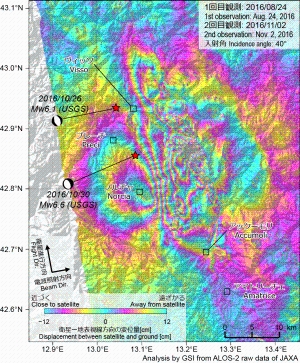
- The pattern and scale of the displacement caused by this earthquake is similar to ones by an earthquake on August 24 (Mw 6.2, southern displacement seen in Fig. 1), and is consistent with a focal mechanism (normal fault with the strike of NNW – SSE direction) estimated from seismic waves.
- The deforming areas of the earthquakes on October 26 and August 24 are not overlapping, i.e., no displacement area exists between the deforming areas.
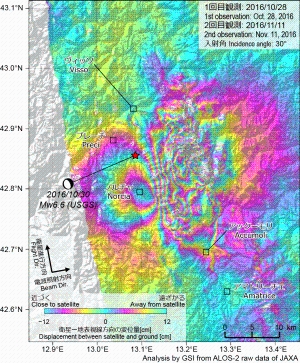
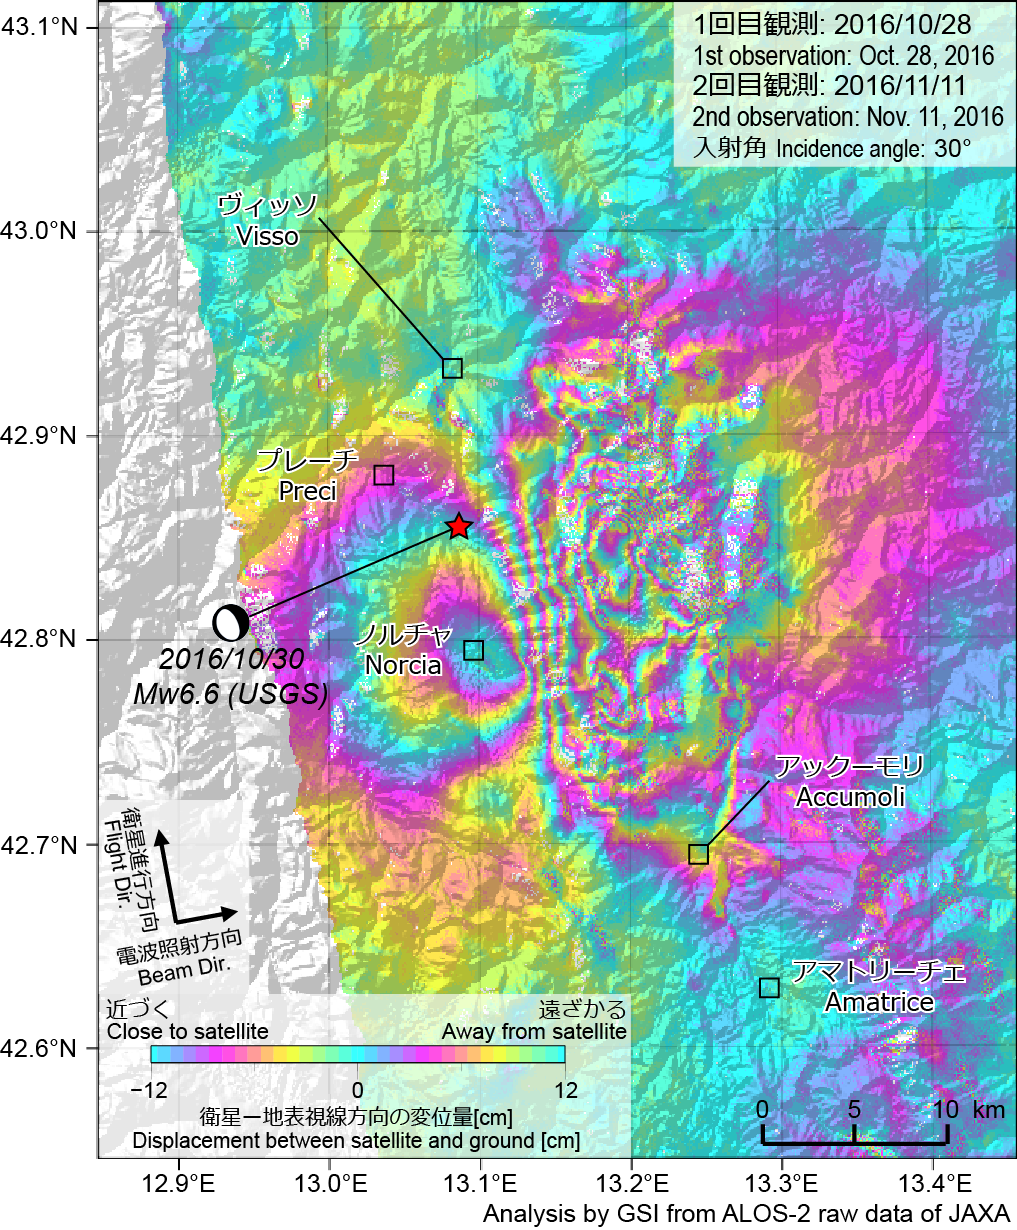
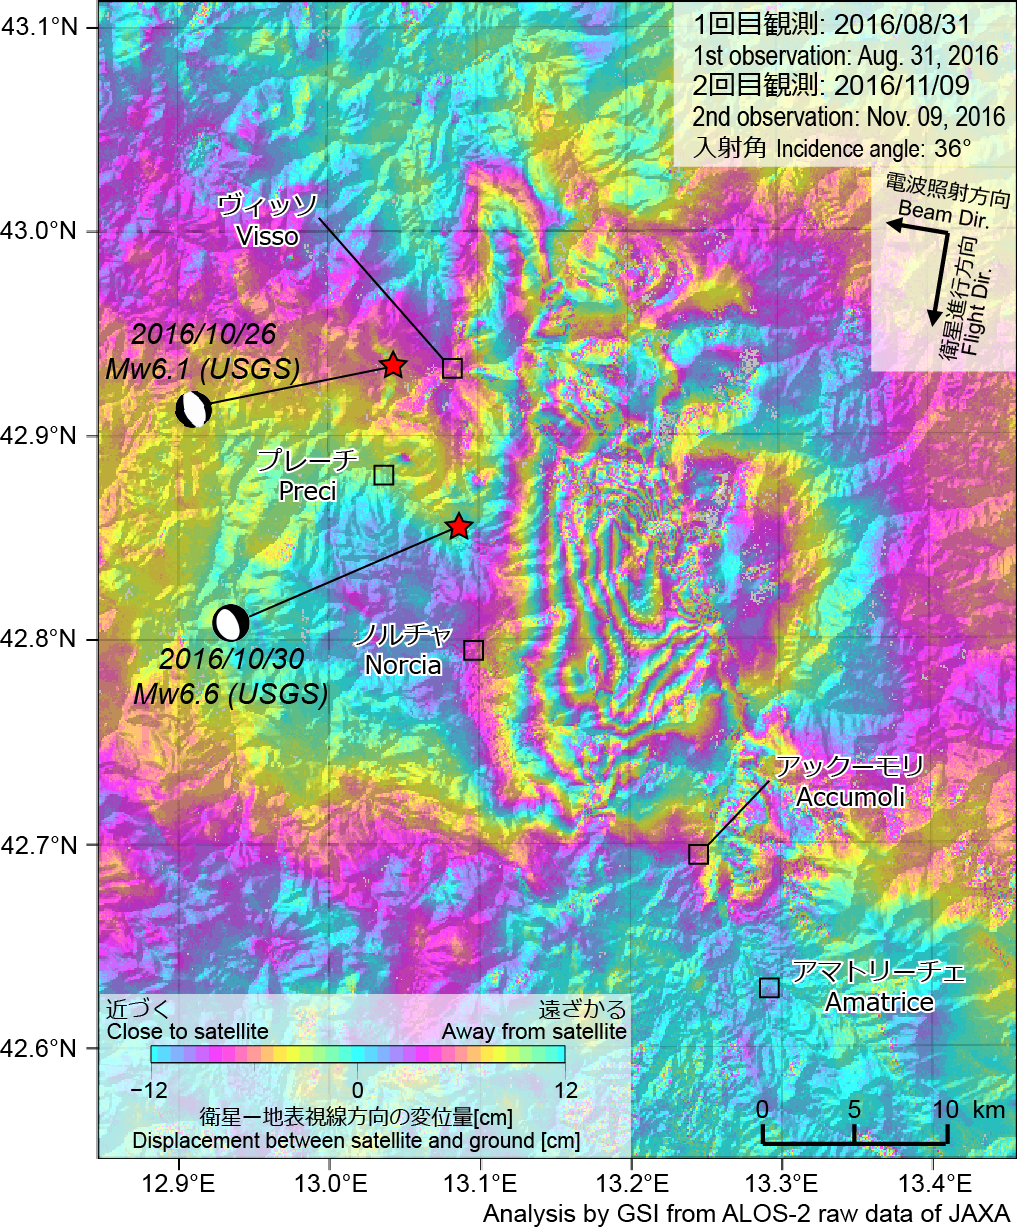
Mw 6.6 on October 30 (Fig. 2)
- The interferogram shows ~ 25 cm displacement toward the satellite around Norcia (7 km south from the epicenter), over 70 cm displacement away from the satellite around 8 km east from the epicenter, and complex phase changes implying complex deformation at further east.
- The area with the complex phase changes is corresponding to the no displacement area of the earthquakes on October 26 and August 24 (Fig. 1), indicating that the earthquake on October 30 ruptured the fault where two previous earthquakes did not rupture.
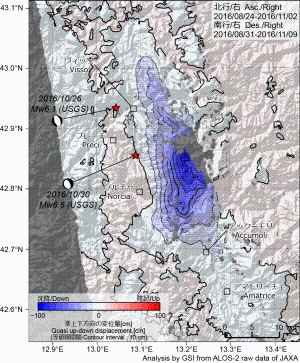
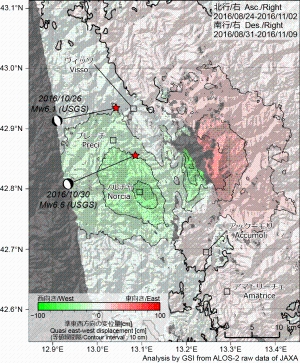
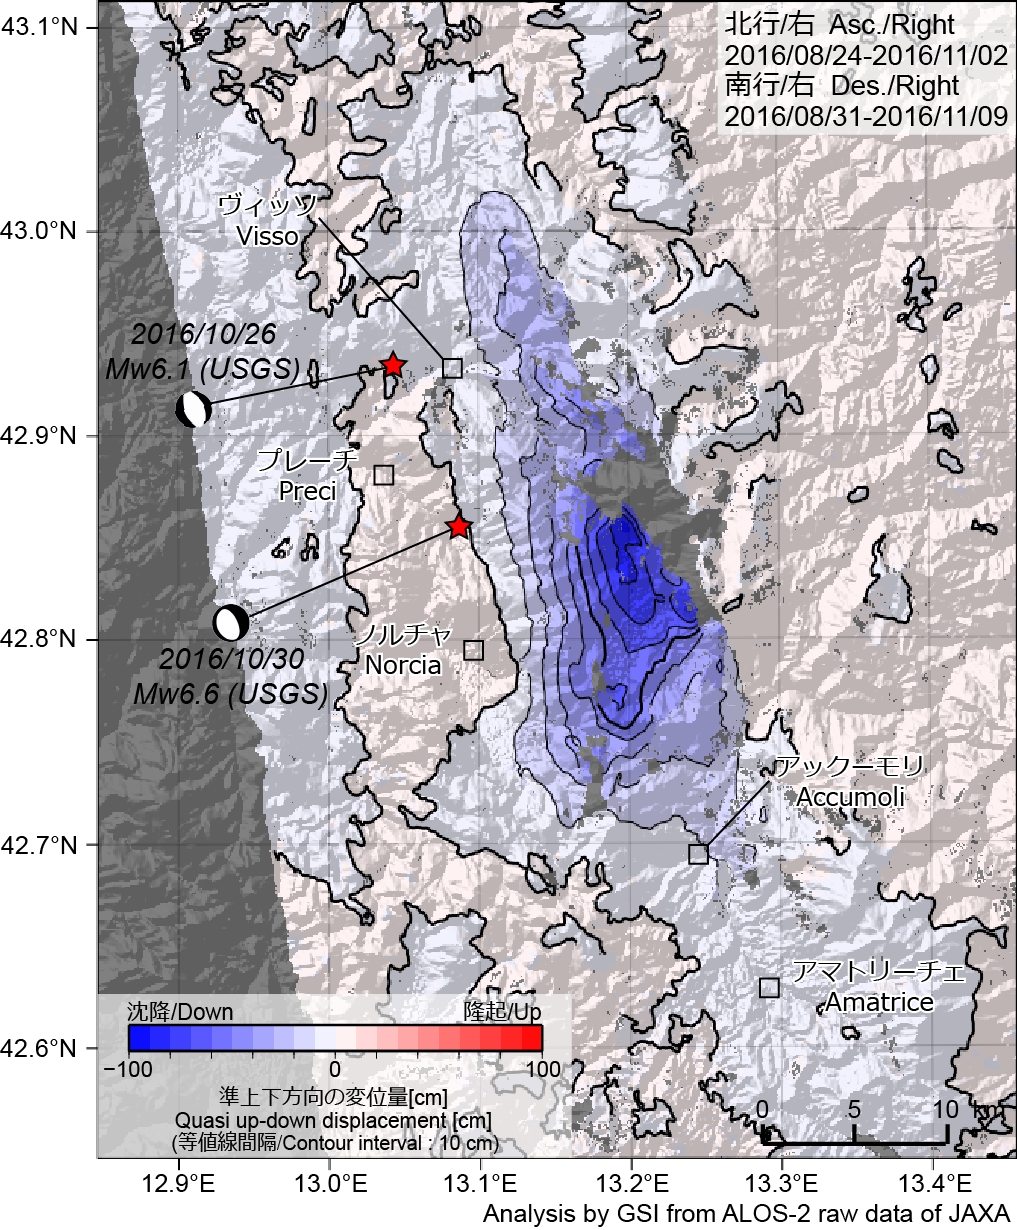
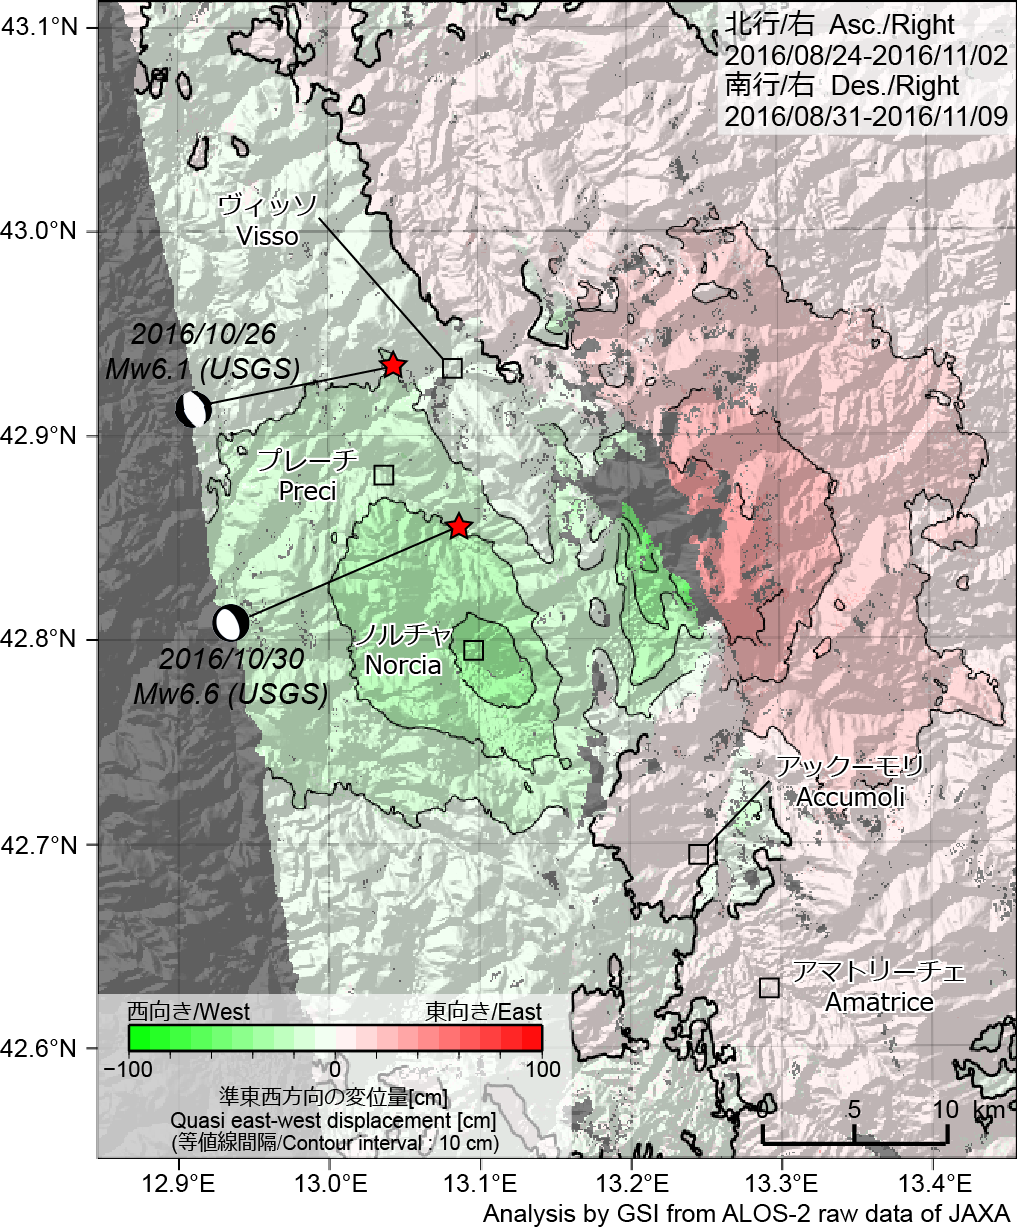
UD and EW components of the deformation caused by the two earthquakes
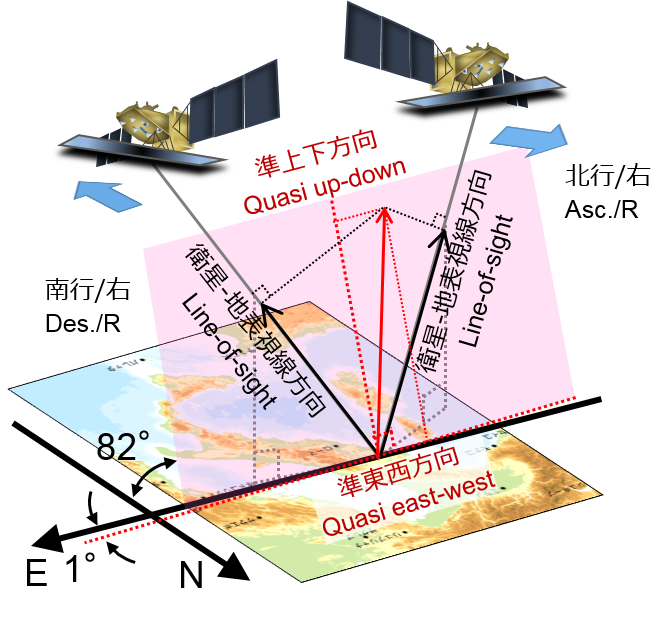
- We calculated quasi up-down and quasi east-west components of the deformation using two SAR interferograms observed from different directions which contain the deformation caused by the both two earthquakes on October (2.5-D analysis, Fig. 7).
- Figs. 5 and 6 shows subsidence of over 80 cm and westward displacement of over 40 cm around 10 km east from the epicenter of Mw 6.6. No clear subsidence but eastward displacement of over 30 cm are seen in the eastside of the complex phase change area. There is another peak of the westward displacement around Norcia, 7 km south from the epicenter, and the amount reaches over 30 cm.
* Note that the result is possibly updated with further elaborated analyses.
SAR Interferograms
Fig.
# |
Date |
Time
(UTC) |
Flight
Dir. |
Beam
Dir. |
Obs.
Mode
*1 |
Incidence
Angle
(Epicenter) |
Bperp |
KMZ |
| 1 |
2016-02-05
2016-10-28 |
22:53 |
Asc. |
Right |
F-F |
30° |
-87m |
1.67MB |
| 2 |
2016-10-28
2016-11-11 |
22:53 |
Asc. |
Right |
F-F |
30° |
+55m |
1.20MB |
| 3 |
2016-08-24
2016-11-02 |
23:00 |
Asc. |
Right |
F-F |
40° |
-96m |
3.22MB |
| 4 |
2016-08-31
2016-11-09 |
11:15 |
Des. |
Right |
F-F |
36° |
-56m |
2.51MB |
*1 F: Stripmap (Fine[10m])
(cf. ALOS-2 Project / PALSAR-2 (JAXA))
Analysis by GSI from ALOS-2 raw data of JAXA.
These results were obtained through the activity of the SAR analysis working group of the Coordinating Committee for Earthquake Prediction.
Quasi up-down and east-west components of displacement
2.5-D analysis
Two or more line-of-sight displacements with different observing directions can be decomposed to quasi up-down and east-west components.
The October 2016 Central Italy Earthquake
| Date-Time |
October 26, 2016, 19:18 (UTC) |
October 30, 2016, 06:40 (UTC) |
Hypocenter
Location |
42.934°N, 13.043°E, Depth: 10.0 km
(USGS, as of November 15, 2016) |
42.855°N, 13.088°E, Depth: 10.0 km
(USGS, as of November 15, 2016) |
| Magnitude |
Mw=6.1
(USGS, as of November 15, 2016) |
Mw=6.6
(USGS, as of November 15, 2016) |
Satellite
ALOS-2 (Advanced Land Observing Satellite 2) launched by Japan Aerospace Exploration Agency on May 24, 2014
Paper, Report, Presentation
In preparation
Copyrights and Credits
Copyright. Geospatial Information Authority of Japan. ALL RIGHTS RESERVED.
We welcome links from your website to this website. When using materials on this website, we ask that proper credit be given.
Contact
YARAI Hiroshi : Head of Division
KOBAYASHI Tomokazu : Chief Researcher
MORISHITA Yu : Researcher
|


