Crustal Deformation map of the Northern Pakistan Earthquake by SAR Image Matching
Summary
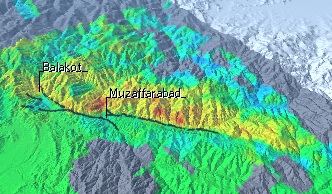
In order to estimate of the location and spread of earthquake source fault caused by the magnitude 7.6 earthquake (USGS) in Pakistan on October 8, 2005, SAR images before and after earthquake with ENVISAT satellite of the European Space Agency was compared. As a result, an appearance of crustal deformation came up on the map.The earthquake source fault turned out as the result of known active faults, which are the active Mazaffarabad fault and Tanda Fault. It was found that heavy damage area was located around the large earthquake fault. In this page, we will introduce the outline of results and the technical background.
SAR arrangement of picture elements, line of sight (LOS), and the measurement principle of crustal deformation
  |
Difference from SAR image (Left) and a picture is due to the arrangement of pixels. On the picture, pixels are laid out by the angle between eye and camera. This applies in the vertical direction (azimuth direction), whereas not in lateral direction (range direction). In the lateral direction of SAR images, the pixels are arranged in a distance (range) of satellite to earth.
The right figure shows geometry of SAR satellite and earth. SAR satellite will create a image by measuring the length aslant from itself to surface.
In the left SAR image centering on a Muzaffarabad, pixels are arranged as the right side of image is closer to SAR than the left side.
Since radar waves are reflected strongly at a surface area toward satellite, the area turns into white on the image. The white area is narrower than the black area of that left side. This is caused by how to arrange pixels. The distance of the satellite to the surface is shorter at higher altitude, and these pixels shifts to the right side by altitude. This phenomenon is called foreshortening.
For this crustal deformation, pixels slightly moved to the right side because the mountain became higher. The pixel offset is about 0.6 pixels of maximum and a pixel interval is 7.8m, so there was change which approaches a satellite 4.7m. |
Crustal Deformation Measurement Technique: image matching method of a SAR intensify image.
 The residual pixel offset by matching two images is the crustal deformation. The residual pixel offset by matching two images is the crustal deformation.
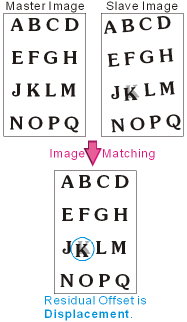
Left figures show SAR images before and after the earthquake, which are the Master image and the Slave image. It is a model figure in the case of filming the alphabet drawn on surface for explanation.
It shows the position of the whole pixel in two images are shifted because neither the position nor the direction of the satellite become the same when filming the earth, when filming the earth.
Correcting a position gap (offset) of this overall image is called image matching.
As the character "K" shown, when there is, in part, a image gap by crustal deformation, a position gap (residual offset) remains after image matching.
If the amount of pixel offset could measure only per integer pixel, crustal deformation measurement would be able to be carried out only per about 5m which is a pixel interval.
However, image matching with 1/32 pixel resolutions is accomplished by performing 32 times FFT oversampling in 2 dimensions.
This makes crustal deformation measurements possible with resolutions about over ten centimeters-several tens of centimeters.
Such resolutions which is inferior to those of interferometry SAR (InSAR) are suitable for the measurements of large crustal deformation. |
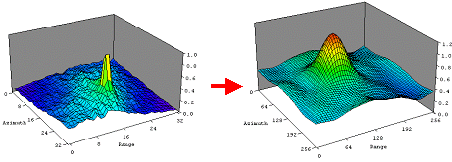 When the pixel offset which 2 images correspond best to is detected as a peak of the cross correlation, the sub-pixel offset is measured by expanding around the peak with 32 times FFT oversampling. When the pixel offset which 2 images correspond best to is detected as a peak of the cross correlation, the sub-pixel offset is measured by expanding around the peak with 32 times FFT oversampling.
Although the technology have been originally developed for the interferometry SAR which positioning was necessary within the 0.1 pixel, it is improved so that it can detect crustal deformation by itself. |
Reference
- Tobita, M., Murakami Mak, Nakagawa H., Yarai H., Fujiwara S., Rosen P. A. (2001), 3-D surface deformation of the 2000 Usu eruption measured by matching of SAR images, Geophys. Res. Lett. Vol. 28 , No. 22 , 4291-4294.
Related pages
Synthetic contents including the result of an SAR interferometry (InSAR) analysis of the Northern Pakistan earthquake and the fault model are here.
|


 Movie
Movie