

Crustal activity in the northern Izu islands related with Miyakejima 2000 eruption
The Exhibition of IUGG2003Abstract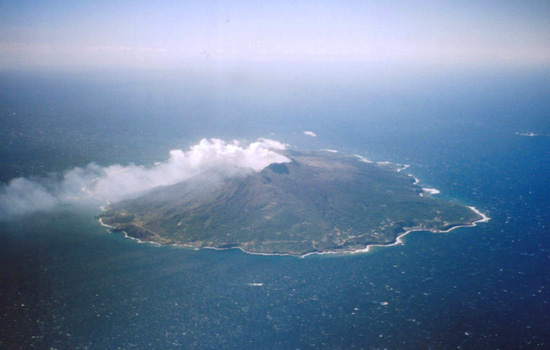
Intense crustal activity including earthquake swarms, eruptions, and a caldera formation in the northern Izu Islands started on June 26, 2000. GEONET data reveals the spatial pattern and time evolution of ground deformation. The observations reveal shrinking and subsidence of Miyakejima and extension between Kouzushima and Niijima (Figure 1). The crustal deformation pattern are explained by several sources consist of a deflation source (0.12km^3) beneath Miyakejima, tensile faults (1.04km^3) located between Miyakejima and Kouzushima, and several shear faults. Mass balance considerations suggest that a large amount of magma migrated 30km from Miyakejima toward Kouzushima.
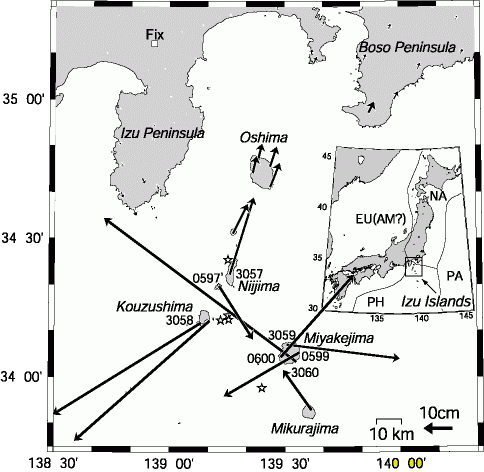
Figure 1. Horizontal displacements at GEONET GPS stations during the period from June 13-22 to August 27-31. Stars show epicenters of the 5 largest earthquakes (Mjma>=6.0) [after Nishimura et. al., 2001, GRL, 28, 3745-3748]. IntroductionThe Izu Islands are a chain of volcanoes lying along the boundary between the Pacific palte and the Philippine Sea plate. Miyakejima, Kouzushima, and Niijima are located in the northern part of the Izu Islands. Miyakejima volcano is an a active stratovolcano. A total of 14 historical eruptions are documented for the past millennium [Tsukui and Suzuki, 1998]. Fissure eruption of basaltic lava on the flank of the volcano is the typical style eruptions including recent ones which occurred in 1940, 1962 and 1983. Most volcanologists anticipated a similar type of eruption would occur sooner or later because of the periodicity of the recent eruptions. However, the 2000 eruption was different from previous ones in many respects. It started with shallow earthquakes in Miyakejima at a depth of ~3km at June 26, 2000. Six hours later, the hypocenters of the earthquakes moved westward to the ocean off Miyakejima. The intense earthquake swarm moved further northwestward toward Kouzushima and continued near Kouzushima for ~50 days. The first eruption at the summit of Miyakejima volcano occurred on July 8. Just after this eruption, the summit collapsed and a caldera was formed. The caldera collapse continued for ~40 days during the period Miyakejima contracted significantly. The depth and diamiter of the caldera reached 550m and 1600, respectively, with collapsed volume totaling 0.6km^3.
GPS observationsGEONET stations observed intense crustal deformation following Miyakejima volcanic activity.
Figure 1 shows horizontal displacements of the GPS stations located in the northern Izu Islands and its vicinity. The vectors show the differences between the average coordinates of June 13-22 and those of August 27-31. It should be noted that the displacement field of the 2000 episode was observed even in Boso and Izu Peninsulas, 100km away. Figure 2 shows the temporal changes in components of selected baselines. Rapid changes of baselines 0599-3060 and 3059-0600 in Miyakejima started almost simultaneously with the earthquake swarms. The speed of the baseline changes decreased gradually during the first 10 days just after the breakout of the swarms. It is interesting to note the polarity of change in the NS and EW components of baseline 3059-0600 reversed on July 27-28. Ten days after the start of the swarm the rate of crustal deformation became almost constant and it continued at this rate until the beginning of September. There were small fluctuations from constant trend of the deformation and it seems that these are associated with the summit eruptions on Miyakejima on July 8, July 14, and August 18. A change in baseline 3057-3058 appears on June 28, as the seismicity migrated and approached Kouzushima. Rapid changes continued for ~50 days. There are several coseismic steps associated with ~M6 earthquakes in the timeseries. There were also fluctuations from the trend and those are correlated with the seisimic activity. 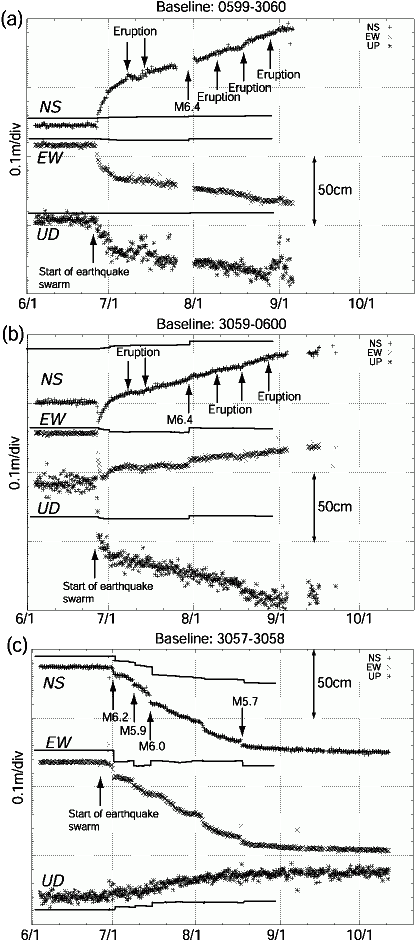
Figure 2. Time series of 6-hour coordinates in selected GPS baselines. Arrows indicate the onset of eruptions of Miyakejima volcano and major earthquakes. Solid lines show the synthetic time series of the modeled earthquakes [after Nishimura et. al., 2001, GRL, 28, 3745-3748]. ModelThe model was constructed by faults of earthquakes and point sources. Figure 3 shows optimal fault model.
At Miyakejima, a point source deflated by 0.12km^3 at a depth of 4.2km, 2km south-southwest to the caldera. This is interpreted as the squeezing of magma form a magma reservoir of Miyakejima volcano. On the other hand, two tensile faults in the region between Miyakejima and Kouzushima opened by 2.3m and 7.8m. There are the intruded dikes associated with a large amount of magma (1.04km^3). The volume of erupted materials (<0.02km^3) [Nakada and Fujii, 2000] is significantly smaller than the volume of the caldera collapse (0.60km^3) [Hasegawa et. al., 2002] in Miyakejima. On the other hand, the volume of the intruded dikes (1.04km^3) is the same order of magnitude as the total volume decrease in Miyakejima (~0.70km^3). This suggests that most of the collapsed materials at the summit of Miyakejima drained back through the conduit to the magma reservoir and migrated northwestward by as mach as 30km in the form of a dike intrusion. 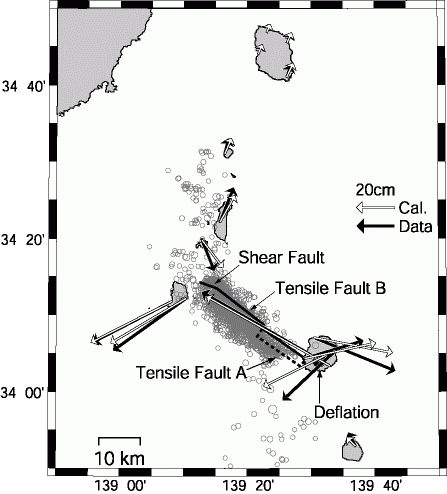
Figure 3. Optimal fault model and horizontal displacements. White and black arrows mean calclated displacements and inversion data defined as the diffrences between the observed displacements and the synthetic coseismic displacemens. Gray circles are epicenters of the earthquakes of Mjma>=3.5 [after Nishimura et. al., 2001, GRL, 28, 3745-3748]. |