

Derivation of Coastal Changes using Two Radar Backscatter Intensity Images.
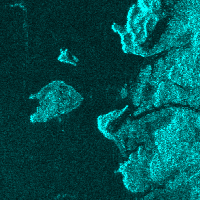
RADAR BACKSCATTER INTENSITYThe roughness of the surface has the greatest influence on radar backscatter. A flat sea surface without waves, for example, gives no backscatter to the satellite and is imaged as black.
 COLOR ADDITIVE PROCESS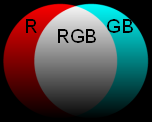
The additive process between red (R,G,B) = (100%,0%,0%) and cyan (R,G,B) = (0%,100%,100%) results in white (R,G,B) = (100%,100%,100%).
First, convert colors in radar images from gray-scale in image before the earthquake to red-scale and from gray-scale in image after the earthquake to cyan-scale.
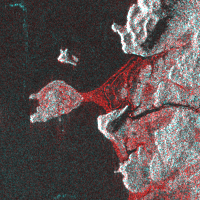
Second, the additive process between the red-scale and the cyan-scale results in gray-scale, red-scale and cyan-scale at unchanged area, area where backscatter decreased, and area where backscatter increased.
COLOR ADDITIVE PROCESS |
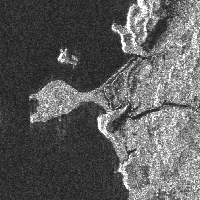
| Before earthquake Radar image |
After earthquake Radar image |
Comparison image Coastal change |
|
| O r i g i n a l |
 |
 |
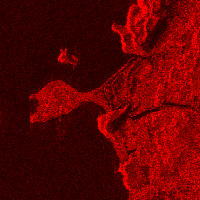
An area colored in red in the image below is a region where the reflective (backscatter) intensity is decreased due to submergence and Tsunami inundation. Western coast of northern Sumatra. |
| C o n v e r t e d |
 |
 |
 |
| 2003-07-22 | 2004-12-31 | After additive process |