Crustal Deformation Observed by Synthetic Aperture Radar (SAR)
Crustal Deformation by InSAR
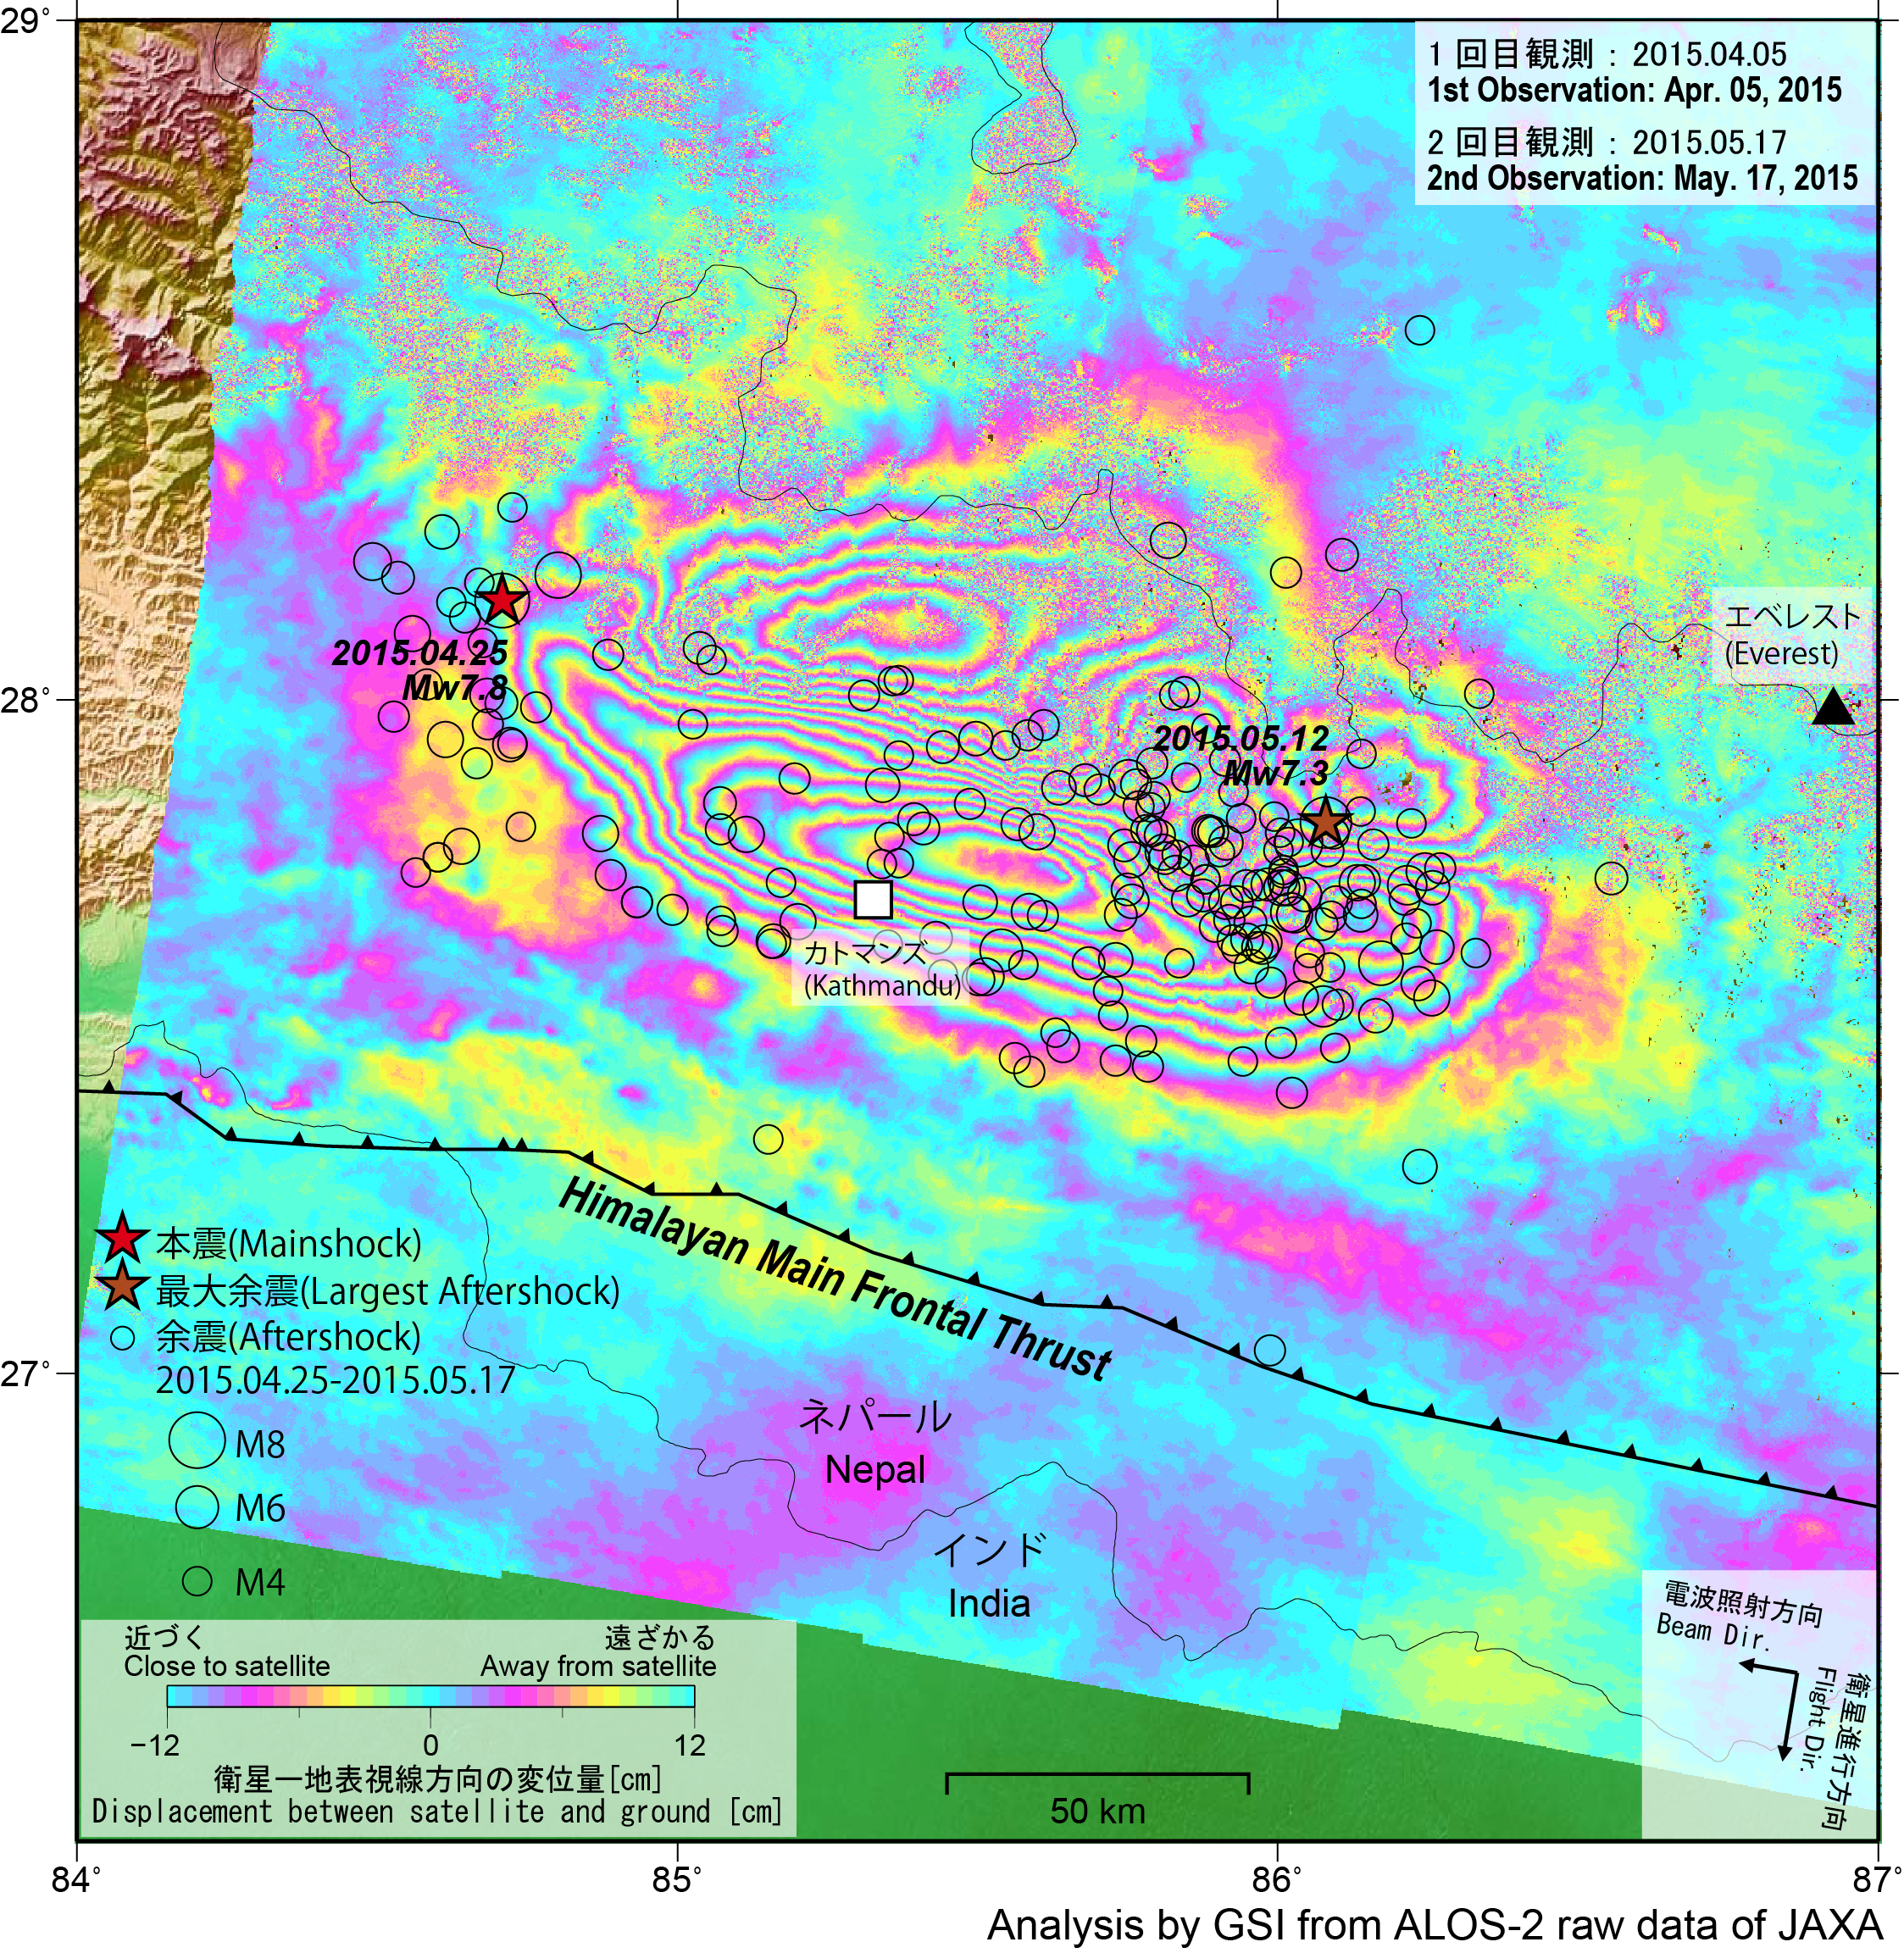
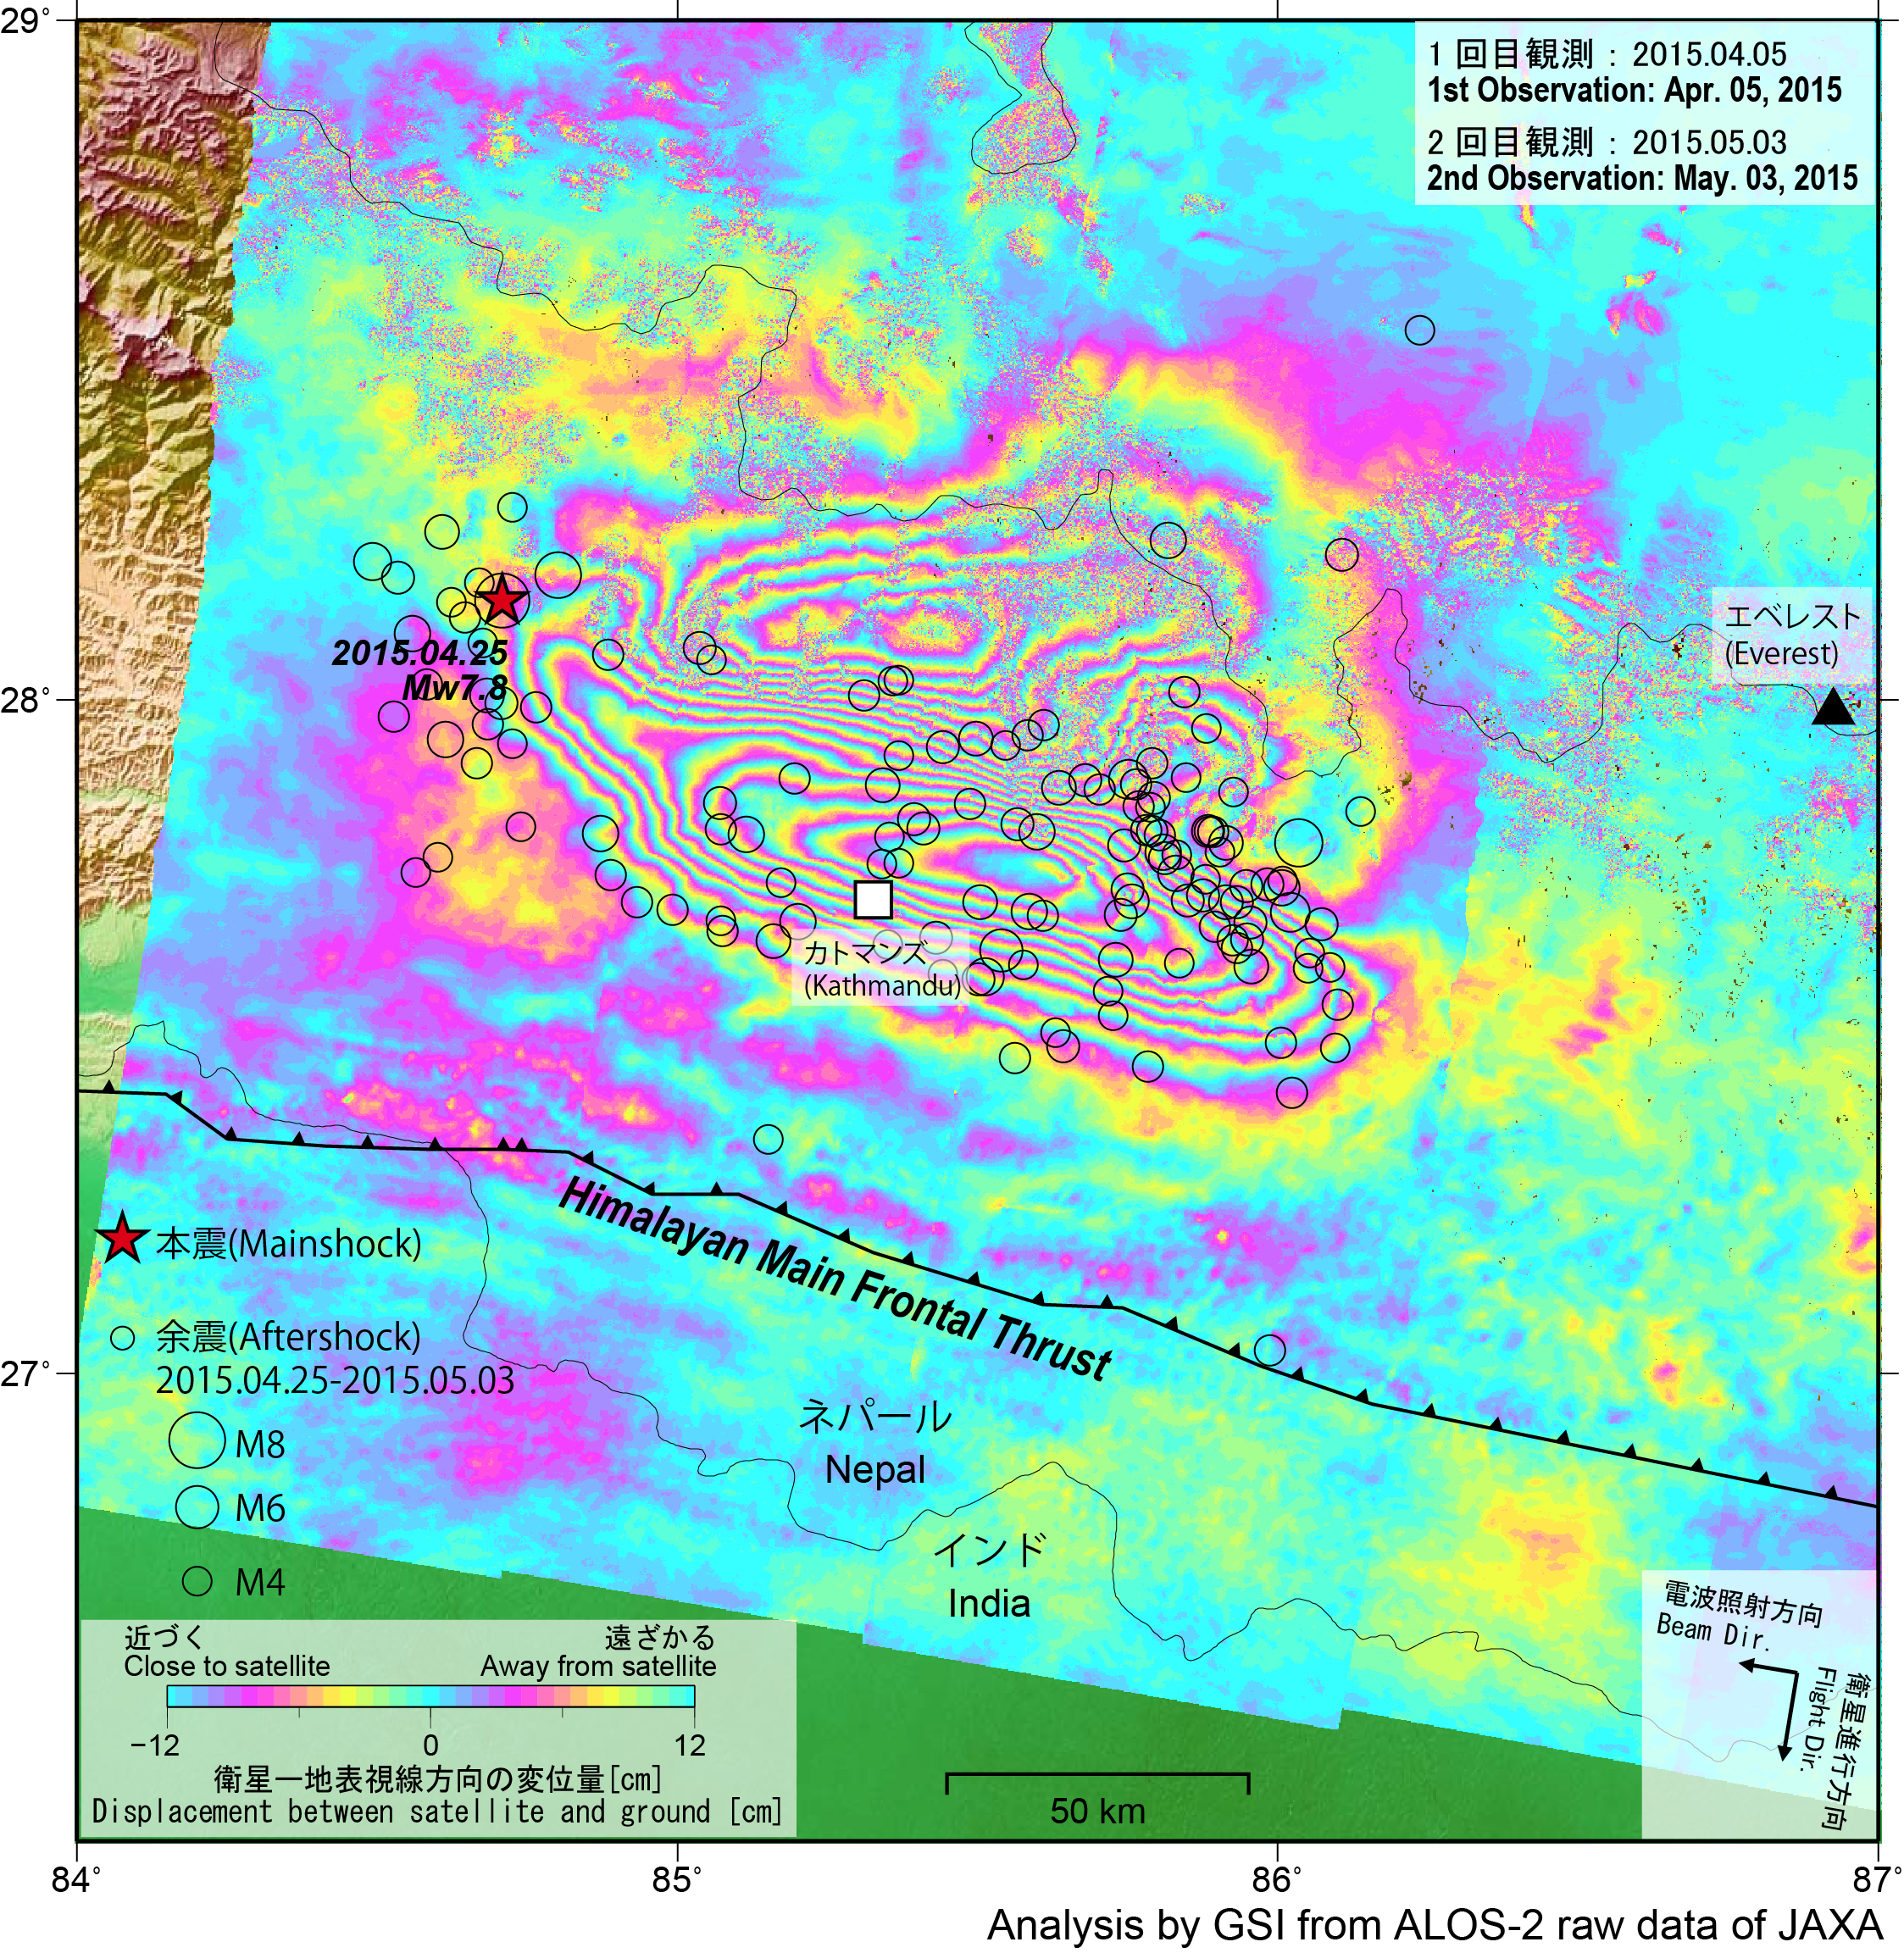
A Mw=7.8 (USGS) earthquake occurred in Nepal on April 25, 2015 (UTC). Applying an interferometric analysis to the data acquired by the Phased Array type L-band Synthetic Aperture Radar 2 (PALSAR-2) onboard the Advanced Land Observing Satellite 2 (ALOS-2), we have successfully detected the surface deformation associated with the earthquake.
[Features of the crustal deformation]
- Main shock on April 25 -
- A major displacement (> 20 cm) area extends with a length of about 150 km in the east-west direction and 100 km in the north-south direction (Figs. 6 and 7).
- Upward/downward motion is observed in the southern/northern area respectively (Fig. 6).
- A maximum uplift about 1.4 m is observed around 20 km northeast from Kathmandu (Fig. 6).
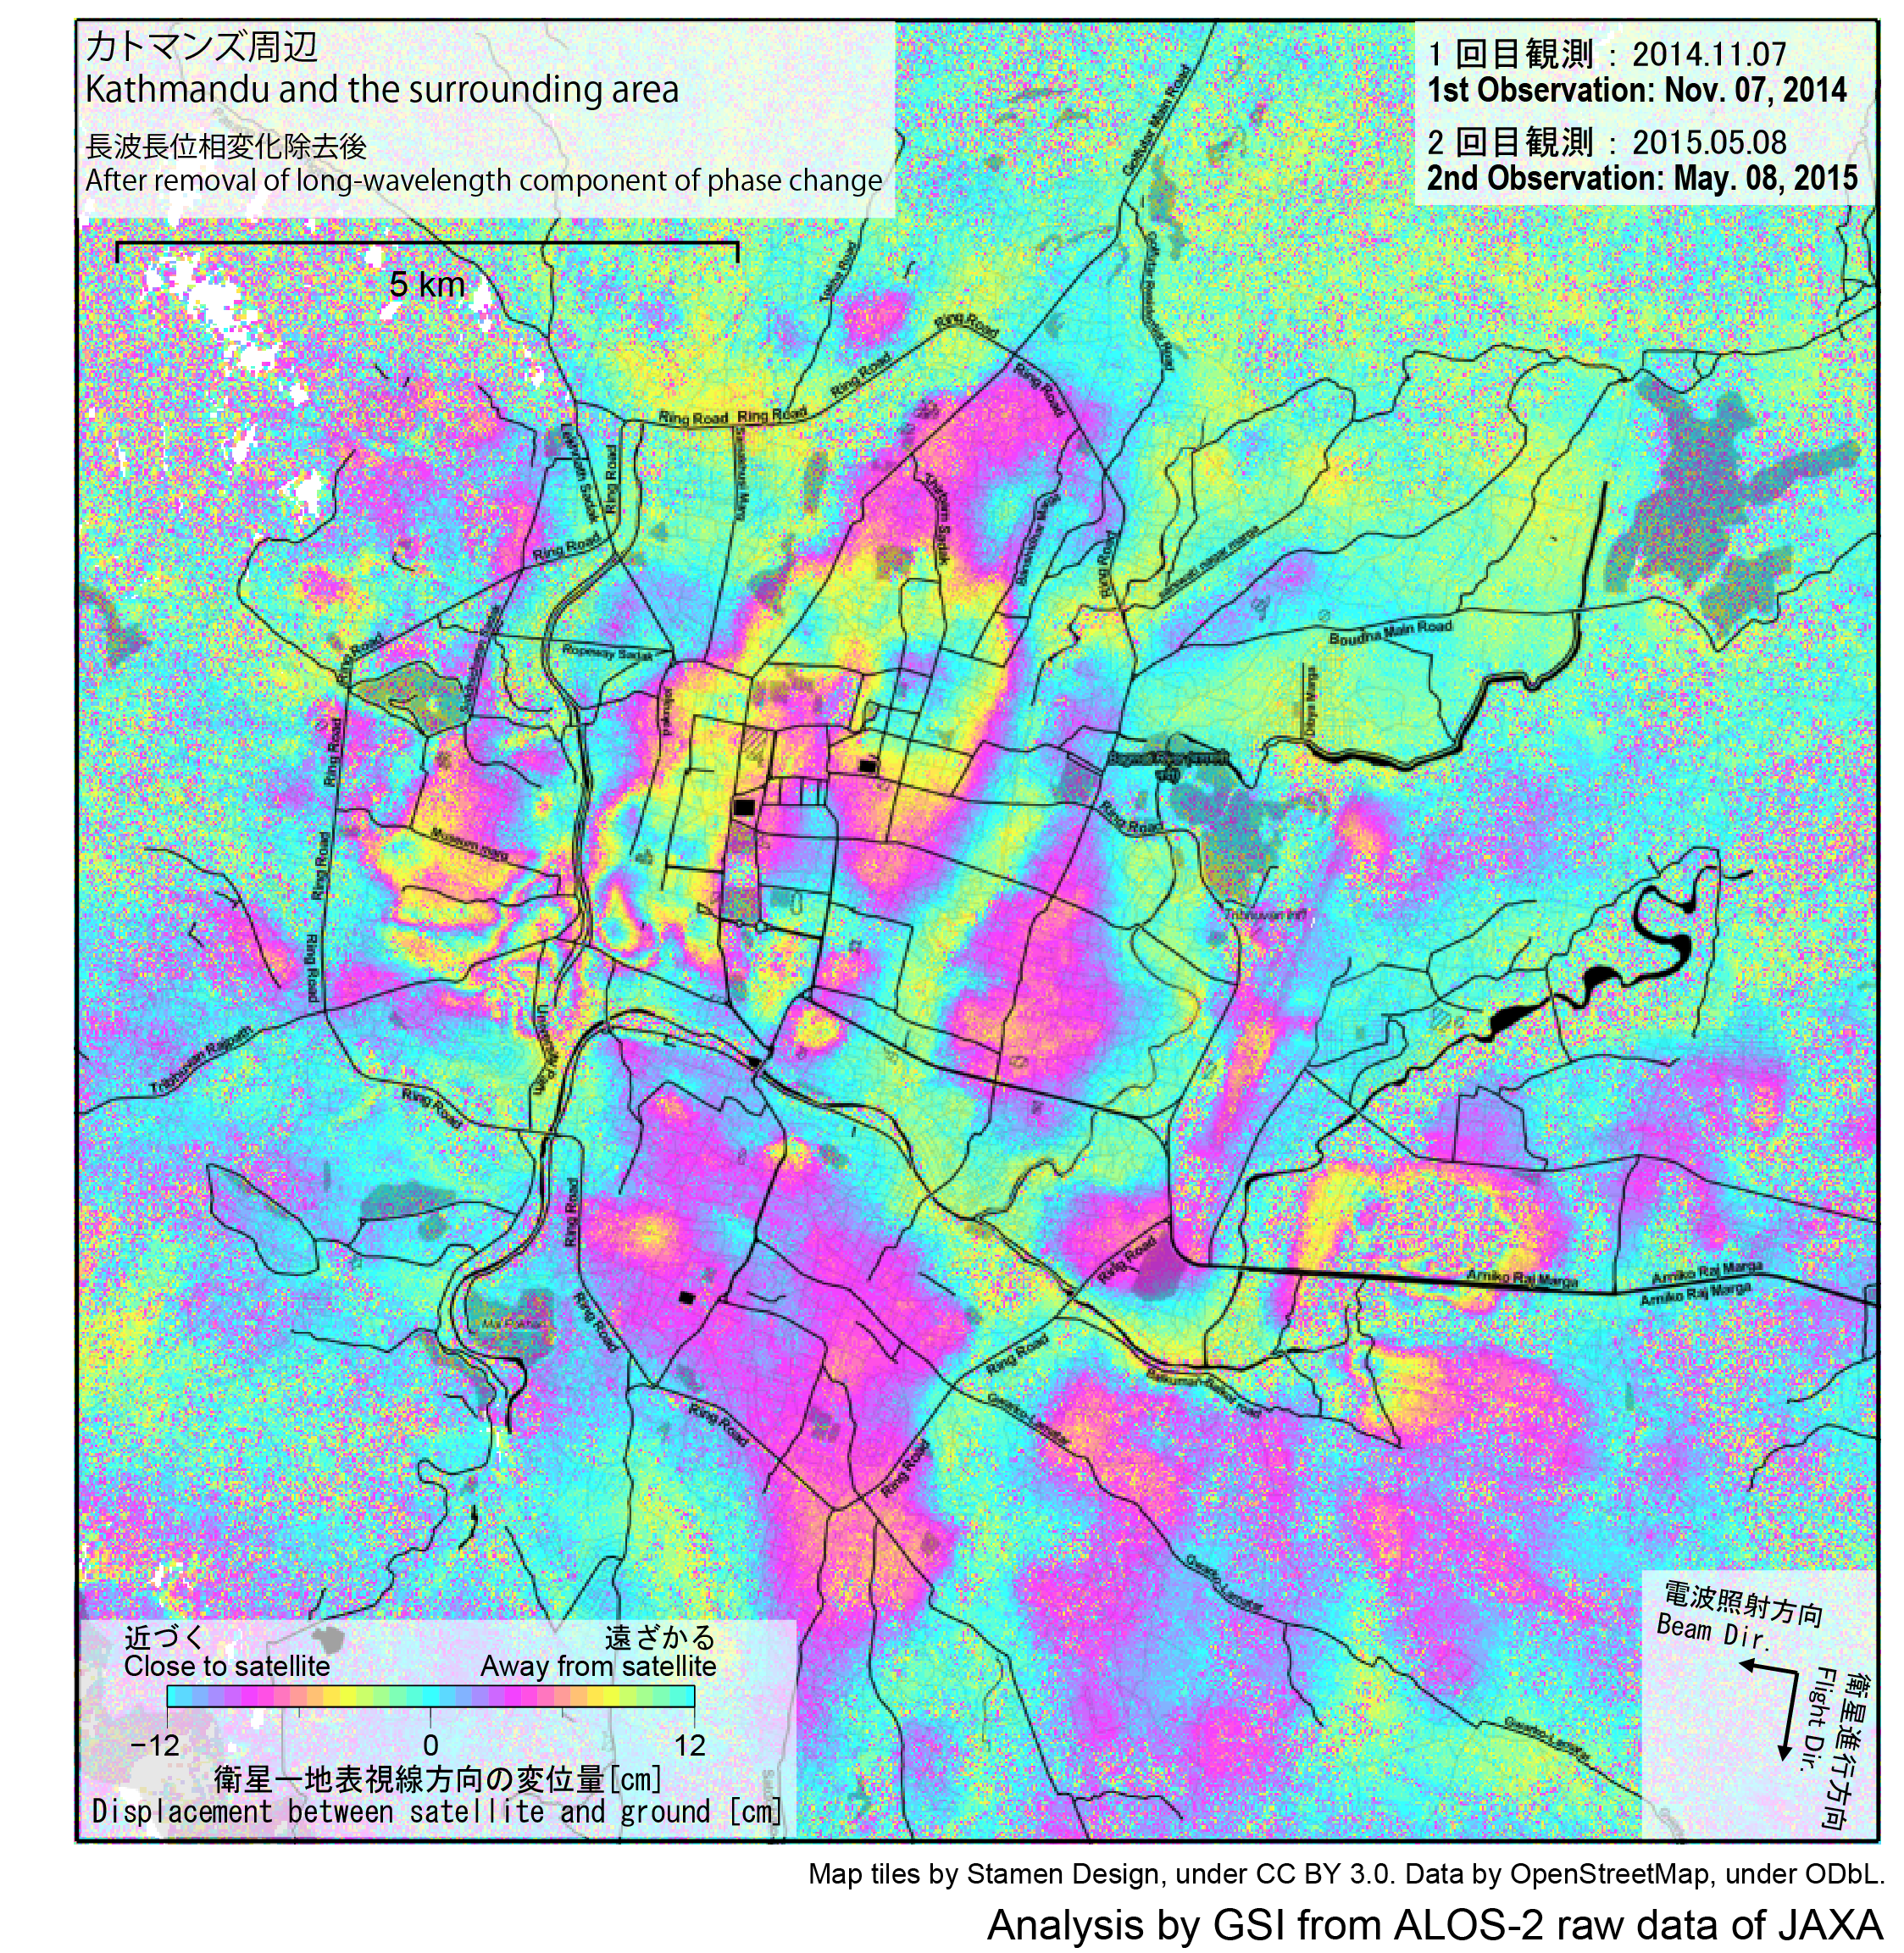
- There is over 1 m uplift and about 30 cm westward displacement in Kathmandu (Figs. 6 and 7). Local subsidence is also observed around the city (Fig. 5)
- An area with large displacement caused by the main shock is consistent with an aftershock region (Figs 1, 2 and 4).
- No clear earthquake surface fault is identified (Figs 1, 2 and 4).
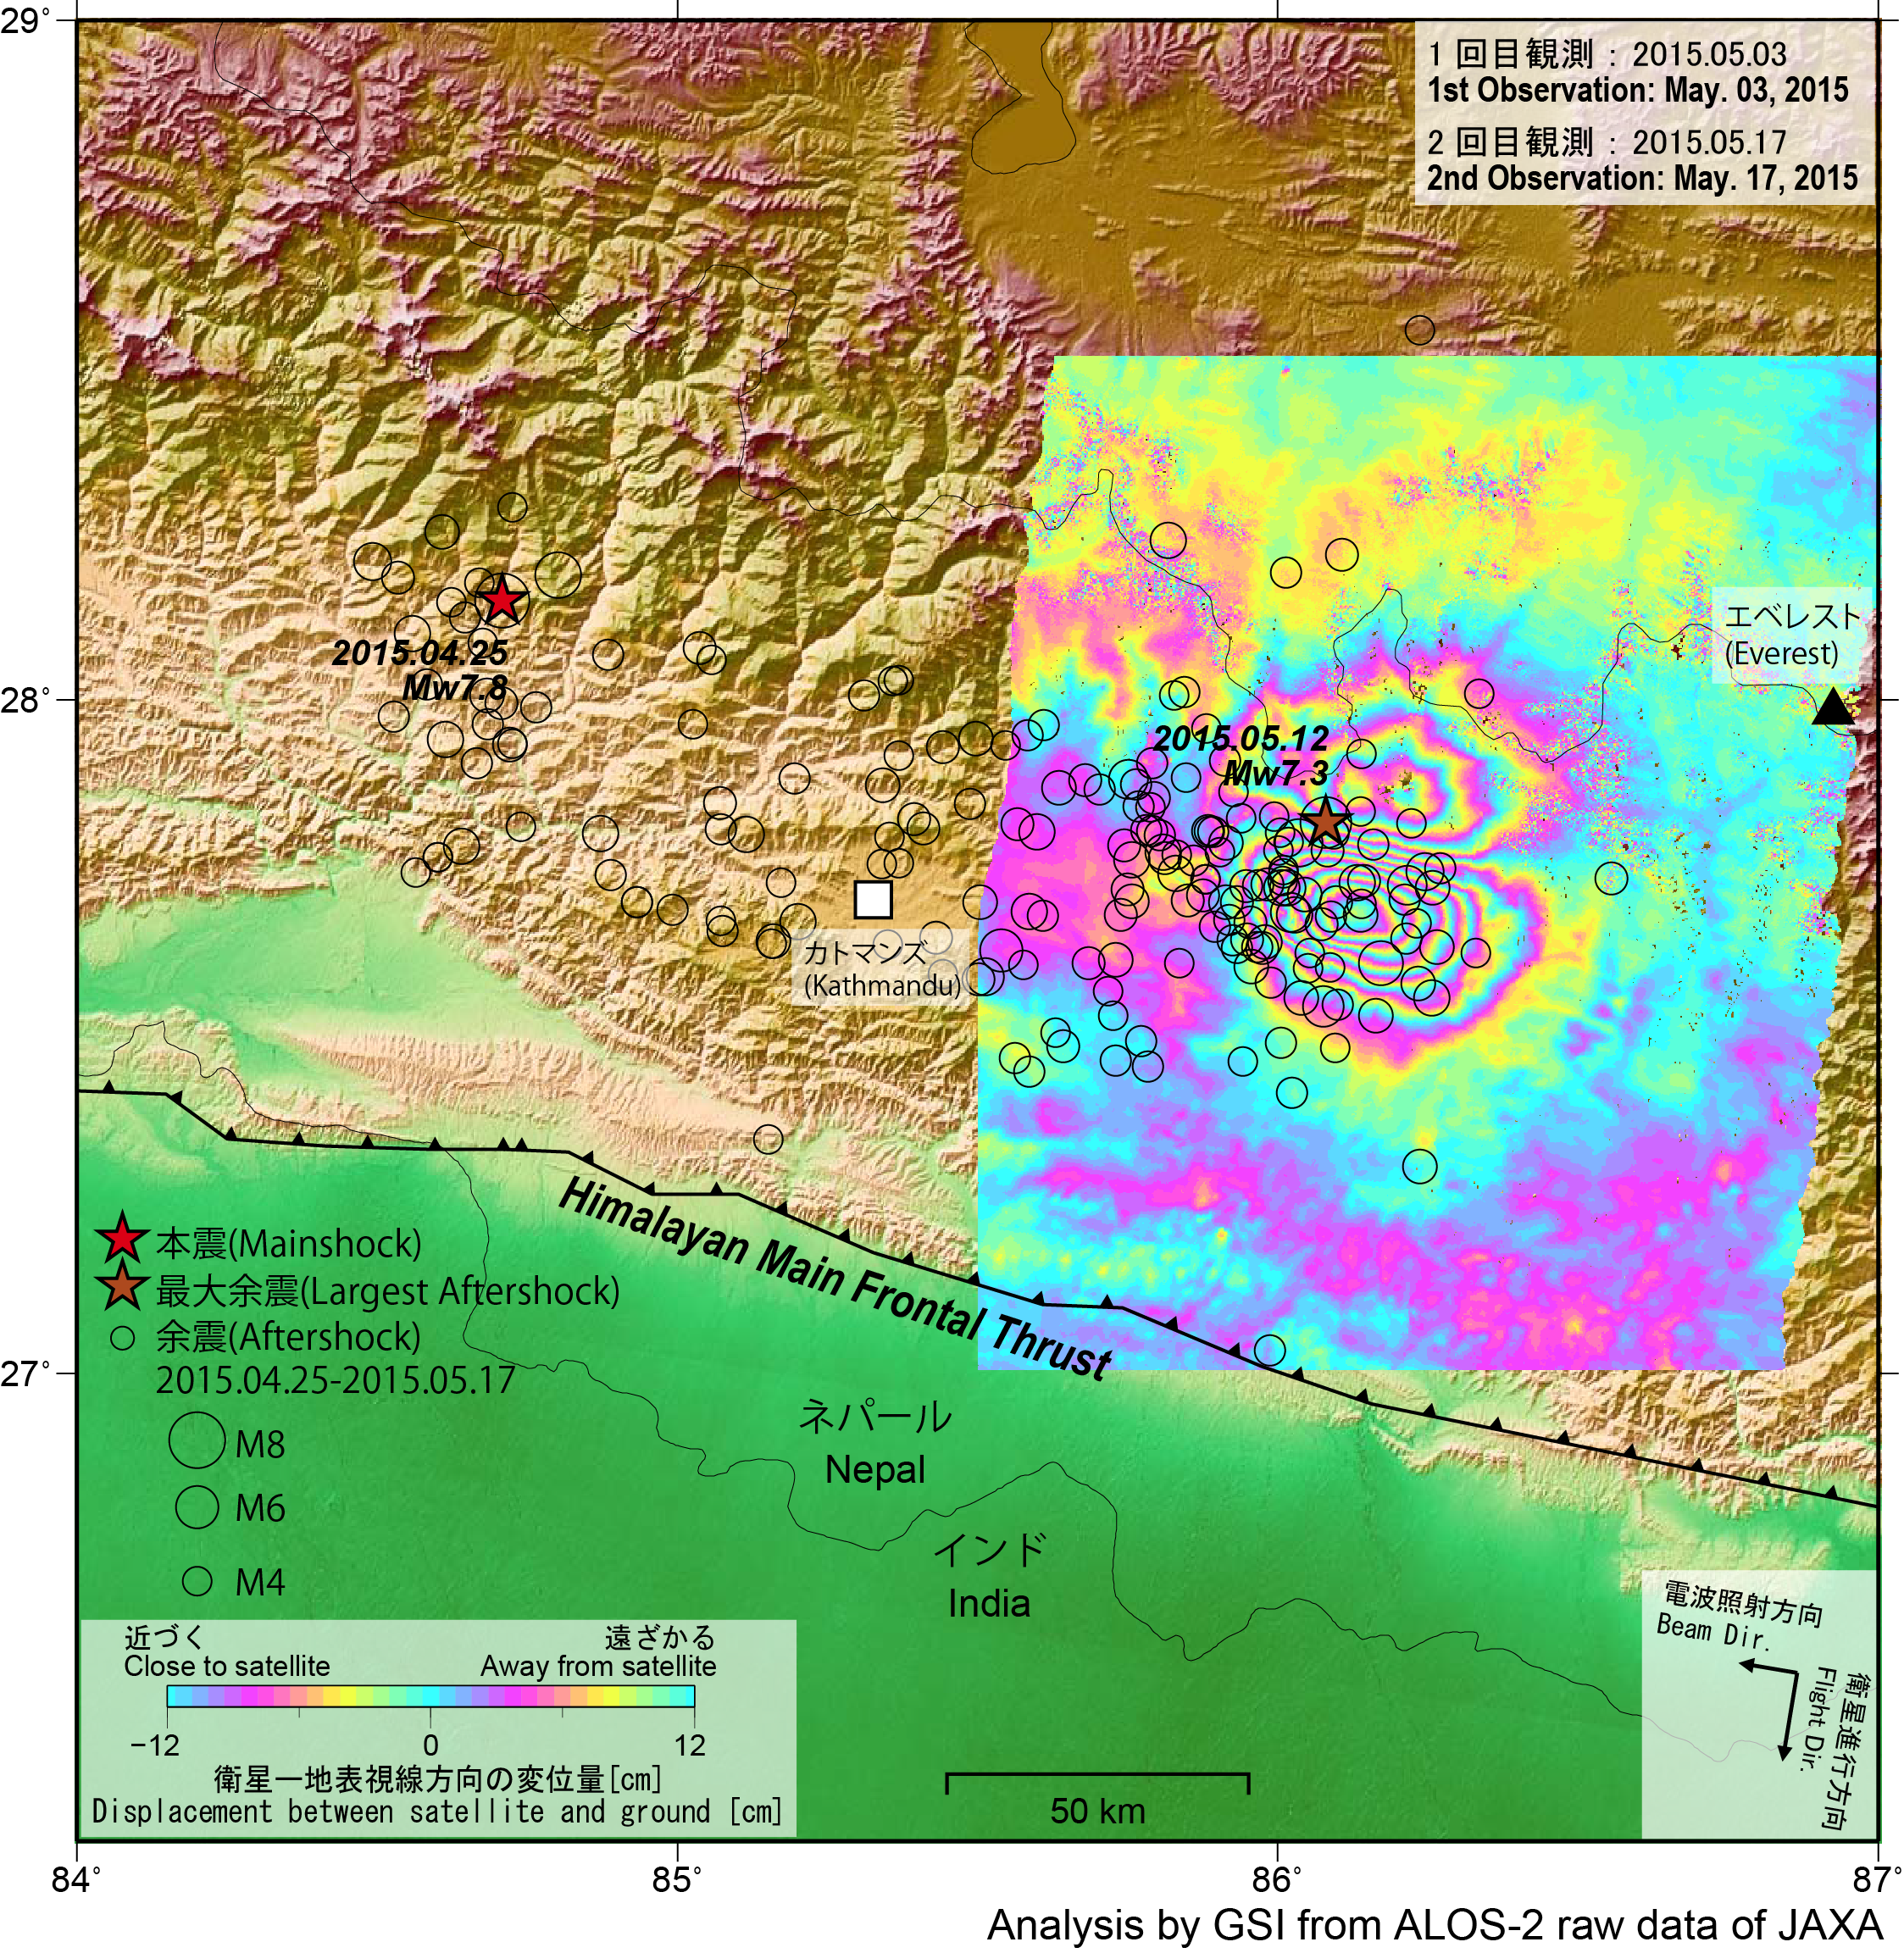
- Largest aftershock on May 12 -
- A maximum displacement (> 70 cm) moving toward the satellite is observed (Fig. 3).
- The aftershock occurred at the area where there was no large slip for the main shock (Figs. 1-4).
[Fault model (Fig. 9)]
- A maximum slip (> 4m) is estimated beneath the area 20-30 km northeast from Kathmandu.
- A reverse fault motion with a slight right-lateral component is estimated on north-northeast-dipping plane, consistent with analyses by seismic waves.
- The estimated moment magnitude is 7.9 (seismic moment 8.2×10²⁰ Nm)
- The largest slip is located in 80 km east-southeast of the hypocenter. The seismic rupture is thought to have propagated toward the east because there is no large slip in the western side of the hypocenter.
NOTE: The result is possibly updated with further elaborated analyses.
Interferograms
Click the images below to enlarge.

Fig. 1[PNG: 2.22MB]
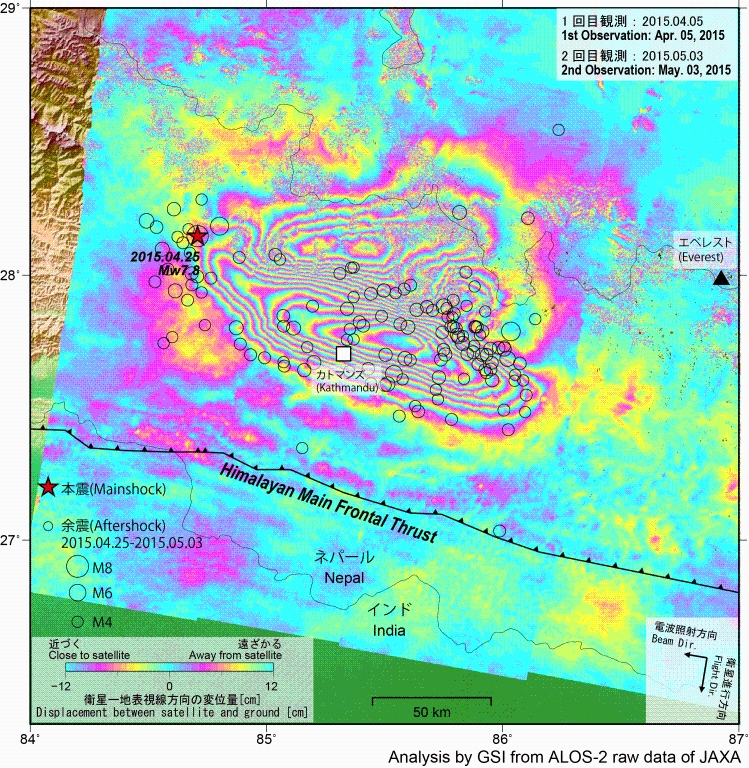
Fig. 2[PNG: 1.93MB]
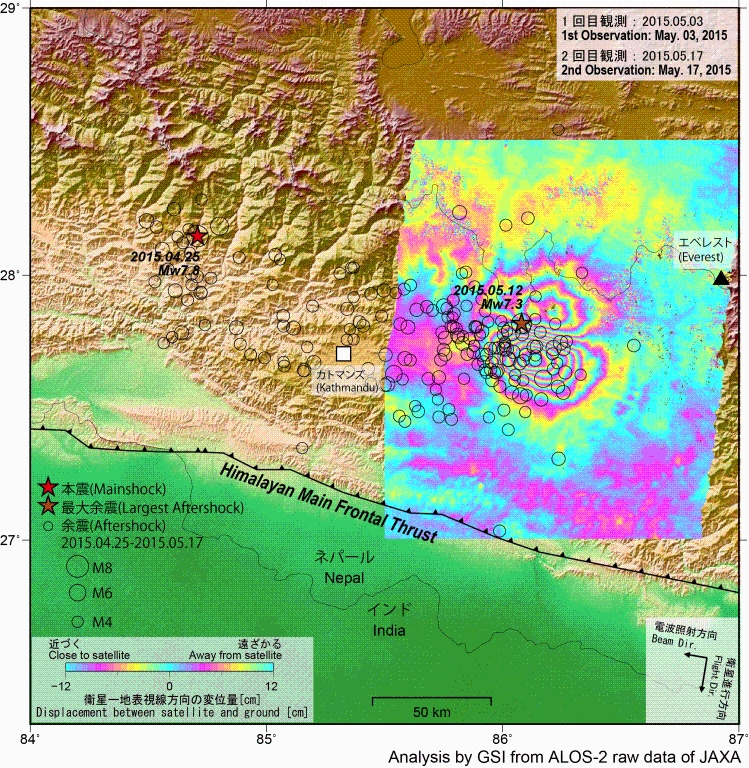
Fig. 3[PNG: 2.70MB]
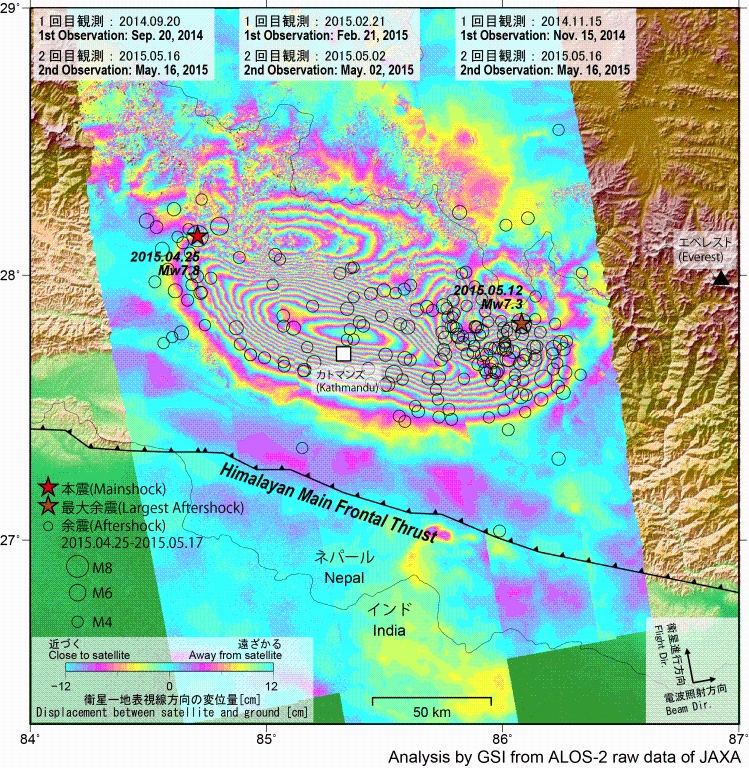
Fig. 4[PNG: 2.47MB]
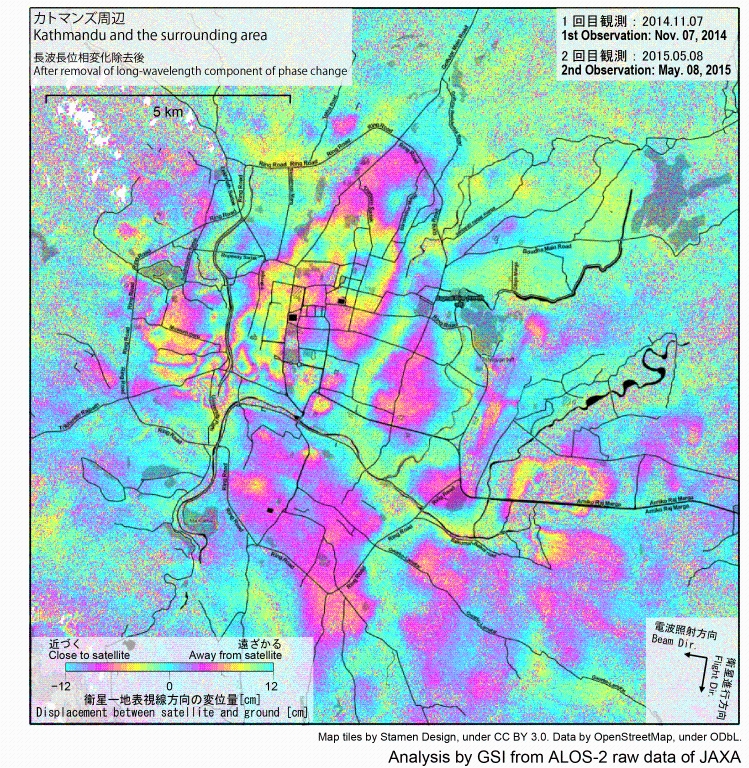
Fig. 5[PNG: 2.04MB]
Fig.
# |
Eq
*1 |
Date |
Time
(UTC) |
Flight
Dir. |
Beam
Dir. |
Obs.
Mode
*2 |
Incidence
Angle |
Bperp |
KMZ*3 |
| 1 |
M/A |
2015-04-05
2015-05-17 |
06:13 |
Des. |
R |
W-W |
26°-50° |
-95m |
2.8MB |
| 2 |
M |
2015-04-05
2015-05-03 |
06:13 |
Des. |
R |
W-W |
26°-50° |
+7m |
2.2MB |
| 3 |
A |
2015-05-03
2015-05-17 |
06:13 |
Des. |
R |
W-W |
26°-50° |
-102m |
2.3MB |
| 4 |
M |
2014-09-20
2015-05-16 |
18:17 |
Asc. |
R |
F-W |
28°-35° |
-397m |
0.4MB |
| 4 |
M |
2015-02-21
2015-05-02 |
18:17 |
Asc. |
R |
F-F |
33°-39° |
-118m |
0.4MB |
| 4 |
M/A |
2014-11-15
2015-05-16 |
18:17 |
Asc. |
R |
F-W |
38°-44° |
-81m |
0.3MB |
| 5 |
M |
2014-11-07
2015-05-08 |
06:20 |
Des. |
R |
U-U |
31° |
+301m |
6.5MB |
*1 Earthquakes causing the displacement. M: Main shock on April 25, A: Largest aftershock on May 12.
*2 W: ScanSAR(Normal), F: Stripmap(Fine[10m]), U: Stripmap(Ultrafine[3m]).
(cf. ALOS-2 Project / PALSAR-2 (JAXA))
*3 If the extension of the kmz file is converted from "kmz" to "zip" when you download it, please change the extension to "kmz" manually.
Analized by GSI from ALOS-2 raw data of JAXA.
These results were obtained through the activity of the SAR analysis working group of the Coordinating Committee for Earthquake Prediction.
Quasi up-down and east-west components of displacement
Click the images below to enlarge.
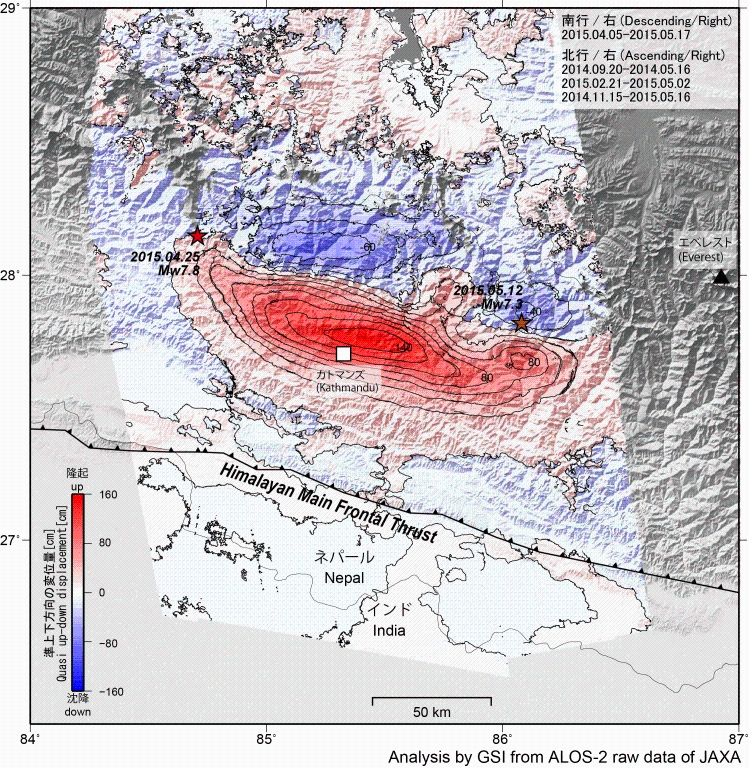
Fig. 6. Quasi up-down component [PNG: 3.01MB]
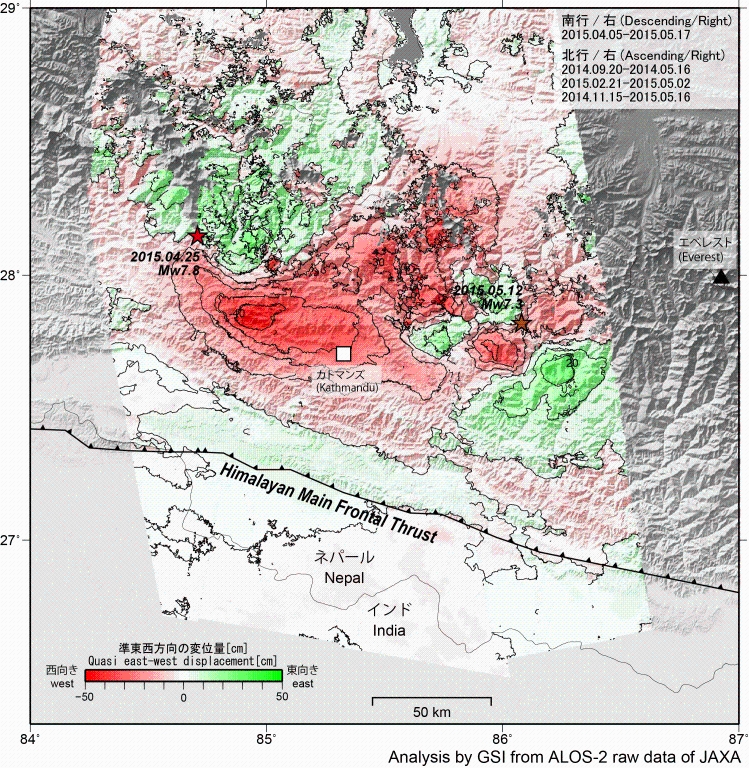
Fig. 7. Quasi east-west component [PNG: 3.12MB]
2.5-D analysis
Two or more interferograms with different observing directions can be decomposed to quasi up-down and east-west components.
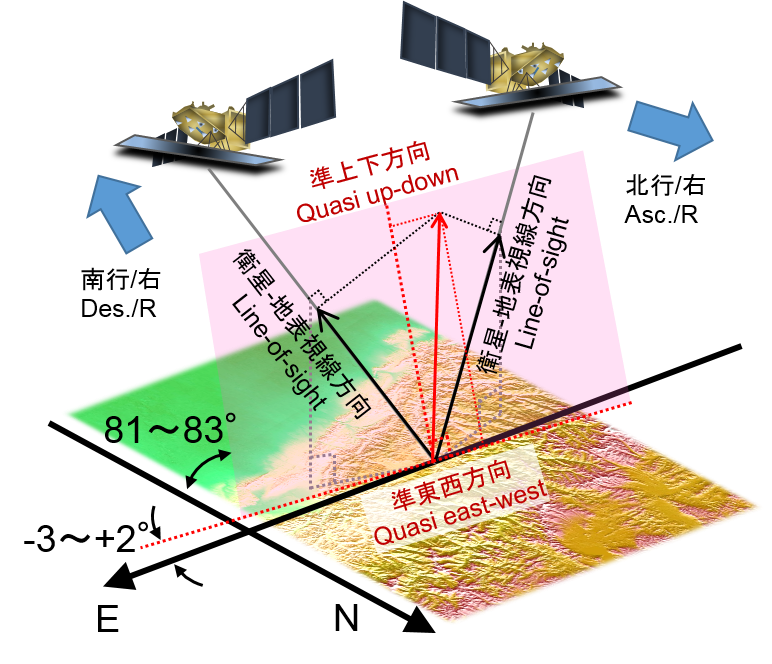
Fig. 8. Geometric relation of 2.5-D analysis
Fault model
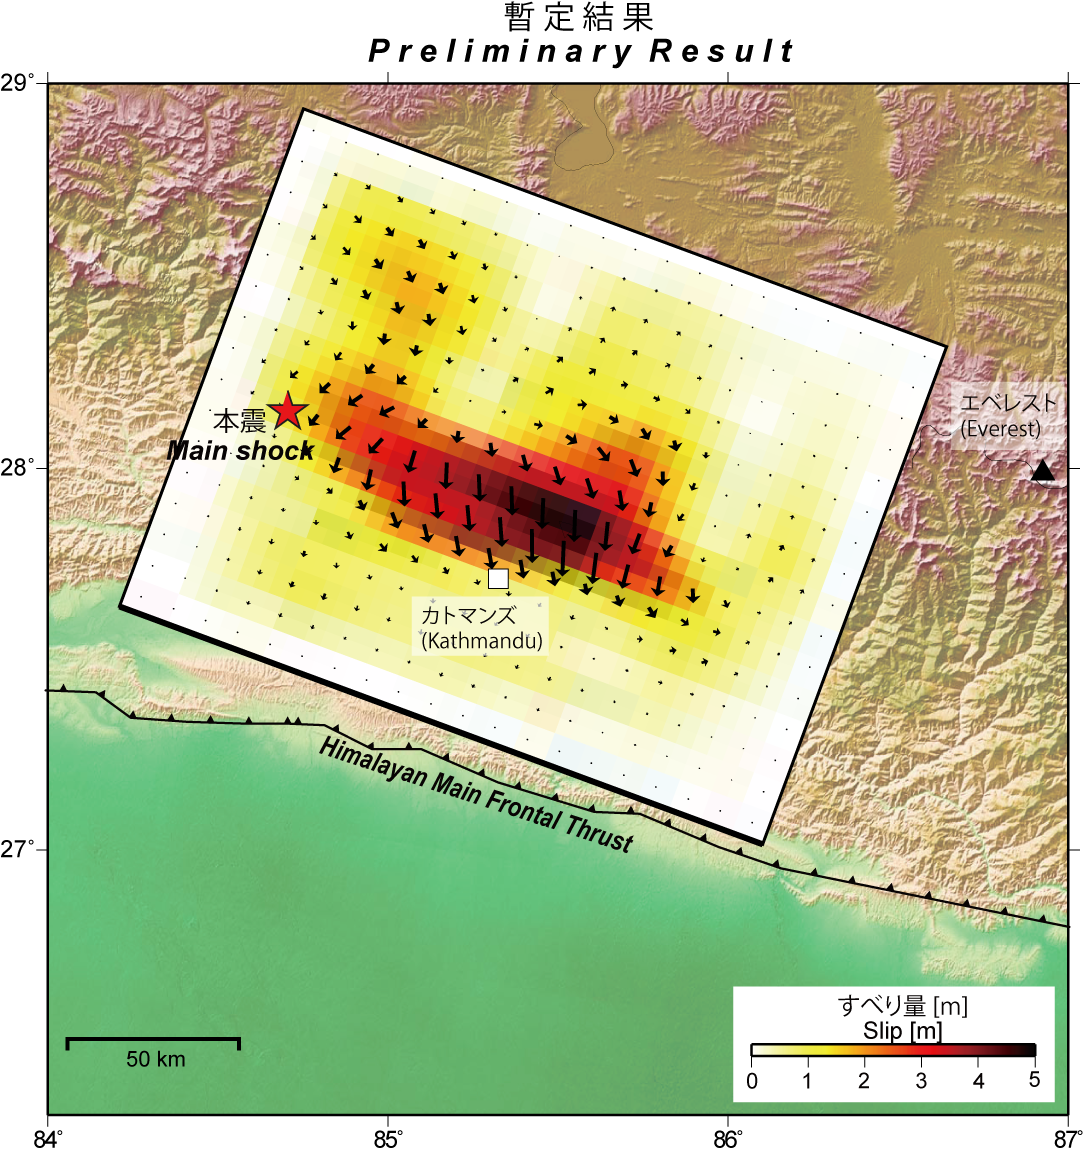
Fig. 9
Nepal Earthquake
[Main shock]
| Date-Time |
April 25, 2015 11:56 (Local Time), April 25, 2015 06:11 (UTC) |
| Hypocenter Location |
28.147°N, 84.708°E Depth:15.0 km (USGS, as of April 30, 2015) |
| Magnitude |
Mw=7.8 (USGS, as of April 30, 2015) |
| Death Toll |
approx. 8,900 (including by aftershocks, as of June 8, 2015) |
[Largest Aftershock]
| Date-Time |
May 12, 2015 12:50 (Local Time), May 12, 2015 07:05 (UTC) |
| Hypocenter Location |
27.809°N, 86.066°E Depth:15.0 km (USGS, as of August 3, 2015) |
| Magnitude |
Mw=7.3 (USGS, as of May 20, 2015) |
Satellite
ALOS-2 (Advanced Land Observing Satellite 2) launched by Japan Aerospace Exploration Agency on May 24, 2014
Paper, Report, Presentation
- Kobayashi, T., Y. Morishita, and H. Yarai (2015), Detailed crustal deformation and fault rupture of the 2015 Gorkha earthquake, Nepal, revealed from ScanSAR-based interferograms of ALOS-2, Earth Planets Space, 67:201, doi:10.1186/s40623-015-0359-z. [html] [PDF: 451MB]
- Morishita, Y., T. Kobayashi, and H. Yarai (2015), Measuring Crustal Deformation Caused by the Nepal (Gorkha) Earthquake Using ALOS-2 SAR Interferometry, S43D-2828, 2015 AGU Fall Meeting. [abstract]
- Morishita, Y., T. Kobayashi and H. Yarai, Crustal deformation caused by the 2015 Nepal earthquake detected by ALOS-2 data and the fault model (Japan Geoscience Union Meeting 2015). [abstract PDF: 79KB]
Copyrights and Credits
Copyright. Geospatial Information Authority of Japan. ALL RIGHTS RESERVED.
We welcome links from your website to this website. When using materials on this website, we ask that proper credit be given.
Contact
YARAI Hiroshi : Head of Division
KOBAYASHI Tomokazu : Chief Researcher
MORISHITA Yu : Researcher
Some files are available in PDF format. To view PDF files, Adobe System's free "Adobe Reader" software must be installed. Please visit the following link to download the free software.
|