

Tokai Slow Slip
The Exhibition of IUGG2003AbstractAnalysis of Global Positioning System (GPS) data shows that the rate of crustal deformations in the Tokai region of Japan, a seismic gap area, changed from the beginning of 2001. Kalman filtering analysis shows aseismic slip on the plate boundary in the western Tokai region centered on Lake Hamana, adjacent to the anticipated Tokai earthquake source area. The cumulative moment magnitude reaches Mw 6.8 in March 2003 with a relative slip increase northeast of Lake Hamana from January 2002. An existence of aseismic slip in the western Tokai supports the hypothesis of a silent event as the cause of uplifting several days before the 1944 Tonankai earthquake.
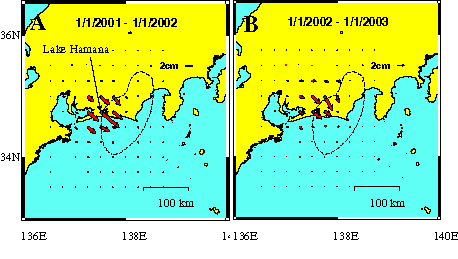
Figure. Estimated slip history of the ongoing Tokai aseismic slip IntroductionThe Tokai region is located along the Pacific coast of central Japan about 200 km to the southwest of Tokyo. The Suruga trough, a subduction plate boundary between the Eurasian plate and the Philippine Sea plate, runs just off the shore of this area (Fig. 1). In this tectonic setting, the Tokai area has experienced large offshore earthquakes with time intervals of around 150 years. Since the 1854 Tokai earthquake, Richter Magnitude M8.4, the Tokai region has been loaded by the Philippine Sea plate and did not rupture at the time of the 1944 Tonankai earthquake (Mw=8.1)(Fig. 1)(1-3). Continuous GPS data since 1994 and historical geodetic survey data by the Geographical Survey Institute of Japan (GSI) for about 100 years indicate a steady strain accumulation in this region (3, 4)(Fig. 2). On the basis of these pieces of evidence, the Tokai region has been regarded as a seismic gap with a potential of Mw8 earthquake. Fig. 2 shows the detected average crustal deformation rate and the asperity or focal area of the future Tokai earthquake adopted by the Central Disaster Management Council of the Japanese government based on many proposed models which were estimated using crustal deformation, seismicity or other available data (e.g. 4-5).
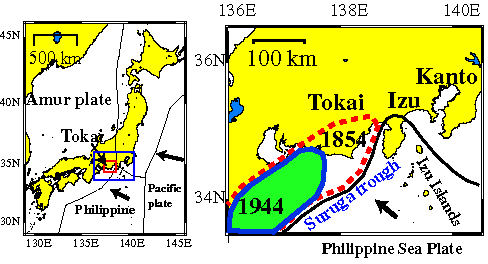
Figure 1. Location of the Tokai region and the past earthquakes in the Tokai 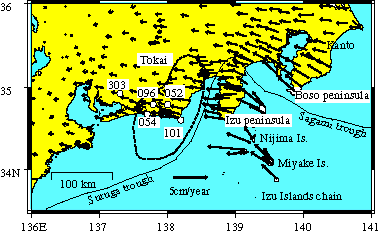
Figure 2. Crustal deformation rate in the Tokai region from 1997 to 1999. Northwestward motions (black arrows) in the Kanto and Tokai regions are mainly due to the coupling effect between the subdcutingPhilippine Sea plate and the overriding Eurasian plate. Dashed line represents the source area of the future Tokai earthquake. Transient Crustal DeformationA large seismo-volcanic event occurred in the Izu islands from July to September 2000 (6, 7), causing southeastward horizontal displacements in the Tokai and northeastward displacements in the Kanto region, central Japan, in a range of up to 3 cm from the dike opening and fault creeping caused by magma intrusion in the Izu Islands (6). After October 2000, the effect of the Izu islands activity faded and the Tokai and Kanto regions returned approximately to the previous normal state of crustal deformation for the period between 1997 and 1999, when displacement rates were almost constant. However, another stage of surface displacements gradually became evident in the Tokai region at the beginning of 2001 in the GPS time series (Fig. 3). The spatial pattern of the observed transient ground motion for the period between March 2001 and May 2003 (Fig. 4A) indicates southeastward motion of around 2 cm at stations 054, 096, 052 in the western Tokai region. Because of the steady northwestward motion observed during 1997-1999 (Fig. 2), the post-2001 data suggest the possibility of aseismic slip between the Philippine Sea plate and the overriding Eurasian plate in the western Tokai region during 2001-2003. Uplift up to 2cm is also observed east of Lake Hamana where maximum horizontal motions occur. Crustal deformation on the Izu islands (Fig. 4A) shows a continuation of the 2000 Izu islands event with much less intensity than the peak period between July and August 2000. Southeastward surface displacements on the Izu peninsula are mostly attributed to the Izu islands activity because displacements in the same direction were observed during the 2000 Izu islands event (6).
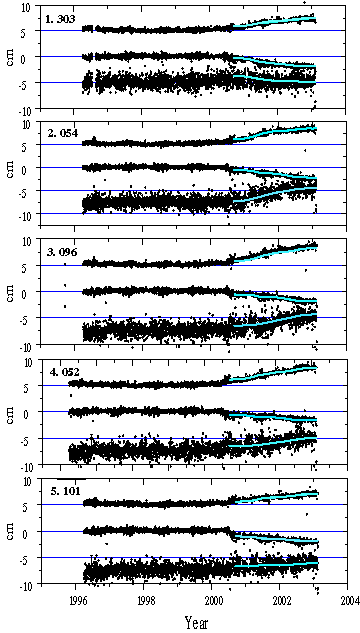
Figure 3. Detrended time series at selected GPS sites in Fig. 2. Blue lines represent computed values from Kalman filtering analysis. 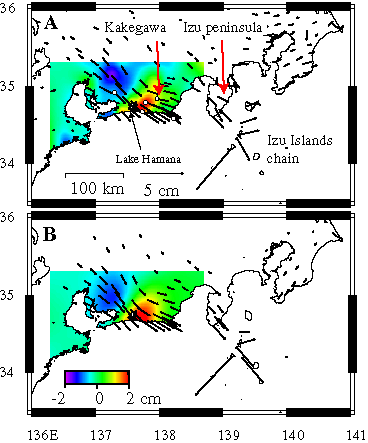
Figure 4. Detrended crustal deformation for the period between January 2001 and d May 2003. (A) observation (B) computed values AnalysisOn the assumption that aseismic slip is causing the abnormal crustal deformation in the Tokai, we estimate the slip history between the Philippine Sea plate and the overriding plate by a Kalman filter based analytical method (8-11) analogous to the time dependent inversion method (12, 13) using the data in Figs. 2 and 3, with the 2000 Izu islands activity taken into account. We use east-west, north-south, and up-down displacement data at 99 selected GPS sites (Fig. 3B) on the Izu island chain, the Kanto and Tokai regions. As a model region, we use the plate boundary estimated by Ishida (14) and the Izu Islands model by Ozawa et al. [2003] (11). Adopting these model regions represented by spline surfaces, we estimated the slip history between September 2000 and May 2003. We set slip components at zero at the edge of the fault patch as a boundary condition. Furthermore we adopt the condition that the slip motion is southward and eastward for the Tokai aseismic slip.
ResultsOur analysis for the Tokai aseismic slip gives an area of slip around the Lake Hamana, western Tokai region, close to the estimated Tokai seismic gap (Fig. 5). In 2002, the estimated slip magnitude decreased near Lake Hamana and a relative slip increase is observed northeast of Lake Hamana (Fig. 5). The time evolution of moment released from the estimated Tokai interplate aseismic slip started in November 2000 and is still continuing, surpassing Mw6.8 in May 2003 (Fig. 6). The computed ground displacements (Figs. 3 and 4 in Transient Crustal Deformation) from the estimated slip model are consistent with the observed displacements. A notable discrepancy is observed in the Boso peninsula where observed eastward crustal motion is not consistent with the model (Fig. 3 in Transient Crustal Deformation). A possibility of aseismic slip between the Pacific plate and the overriding Philippine Sea plate off the Boso peninsula is pointed out by Ozawa et al.[2003] (15) .
Previous studies of silent earthquakes suggest a tendency for aseismic slips to occur in weakly coupled regions (16, 17), such as the western Tokai region. Re-examination of the past electric-distance measurements suggests a possibility of at least two similar silent events near the area of the estimated silent event of 2001 (18, 19) during the periods 1978-1983 and 1987-1991. Though the past two silent events did not lead to a catastrophic earthquake in the Tokai region, we do not know what factor keeps silent earthquakes from leading to catastrophic rupture or if the 2001 silent event will eventually subside or lead to a catastrophic event. Since the change of deformation rate is now critical of the accuracy of GPS measurements in the Tokai region, intensive monitoring on the temporal evolution of this phenomenon and timely update of a physical model are necessary. The detection of the 2001 silent event supports the hypothesis of a silent earthquake as the cause of the upheavals in the Kakegawa (Fig. 3 in Transient Crustal Deformation), inland of the Tokai region, detected by leveling several days before the 1944 Tonankai earthquake, because the present aseismic slip area is close to the assumed silent event in 1944 (20), and both caused uplift in Kakegawa (Fig. 3 in Transient Crustal Deformation). With regard to a question of what triggered the present silent event, the 2000 Izu Islands event is one possible candidate. The stress change from crustal deformation in the Tokai and Kanto regions during the 2000 Izu Islands event may have reached a critical point, resulting in a aseismic slip in the Tokai region.
Figure 5. Estimated slip history of the ongoing Tokai aseismic slip 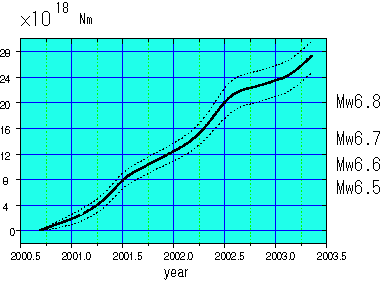
Figure 6. Time evolution of estimated moment of the Tokai aseismic slip References
|