

What is the "Active Fault Map "?
Overview of active fault surveyingTo respond to the increased demand for information on active faults in the wake of the Great Hanshin-Awaji Earthquake in 1995, the Geospatial Infomation Authority of Japan (GSI) began to work with active fault researchers in 1995 to create the "Active Fault Map", a series of 1:25,000 scale maps showing detailed locations of active faults in land area of Japan.
Types of active faultsActive faults are those faults which, during the past hundreds of thousands of years, have repeated activities in intervals of roughly 1000 to tens of thousands of years that have left their mark on the landform, and which may continue to repeat activity in the future. Active faults can be classified into one of the following four categories based on displacement patterns. In soft layers where displacement has spread out, the faults manifest themselves not as unevenness on the surface, but as flexures. 
How to identify active faultsThe accumulated activities of active faults form a distinct fault displacement topography. Aerial photographs are often used to identify such topography. Fault displacement topographyFault displacement topography can contain such geomorphological features as low fault cliffs, terminal facet, offset channel, fault pond, and shutter ridge. 
Aerial photograph interpretationTo compile the maps, two photographs taken from the air are put side by side and viewed with a stereoscope to look for displacement landforms. Displacement that has been caused by fault activity is extracted, and investigations are conducted to determine if the fault has the potential for repeated activity in the future.
The Adera Fault in the vicinity of Sakashita Town, Gifu Prefecture As we can see in the photo, the right bank of the Kiso River near Sakashita Town is composed of several river terraces. Most of the low cliffs on the terrace boundaries appear to have been formed by erosion from the river side. However, the cliff running NW-SE through the center of the town (Line AB in the figure) is not a terrace cliff formed by the river. The terraces designated by Sg, Tb, Sk, Sh surround the fault cliffs and are cut by the fault to form unevenness. While displacement caused by vertical movement is striking in this photograph, it was proved by researchers that the horizontal displacement is about 5 times as great. There is leftward slippage for the terrace cliff of roughly the left side of the place where rail line crosses the fault. Repeated fault activities during a 25,000-year period has created a lateral slippage of more than 80 meters, which was quite distinct during the on-site survey. From the measurements of the age of the terrace deposits and the size of the slippage during the period, the displacement in year units can be calculated to show the level of activity of active faults.
Survey methodologyThe Active Fault Map were mainly compiled by studying and interpreting aerial photographs while referring to results of previous surveys. Using our large-scale (max. 1:10,000) aerial photographs from the latter 1940s and 1950s (the older the better), we can study the topography of suburban and exurban zones that has not been artificially altered by development. Furthermore, to maintain balance of interpretations of surveyors in identifying faults, several surveyors work together (crosscheck) to reach a consensus, then the results are transferred to 1:25,000 topographic maps.
How the maps are usedThe Active Fault Map at 1:25,000 scale is large enough to show detailed locational relationships between active faults and large structures such as hospitals, schools, and roads. Besides locations of active faults, the maps also show major topographic features, such as terraces, alluvial lowlands, and landslide topography that were formed during the late Quaternary (hundreds of thousands of years ago to the present). This additional information is also very useful for disaster prevention as it allows us to do such things as understanding the ground conditions around the faults and identifying areas where landslides might be regenerated by the activity of active faults.
About the size of the map sheetThe area of one Active Fault Map covers depends on whether it is a horizontal or vertical composition map. Horizontal composition maps cover an area of 15 minutes from east to west (approximately 20-23 kilometers, depending on the latitude) and 10 minutes (about 18 kilometers) from north to south. Vertical composition maps cover an area of 12 minutes from east to west (approximately 17-19 kilometers, depending on the latitude) and 14 minutes (about 26 kilometers) from north to south. One active fault map covers the same area as four of the 1:25,000 topographic maps issued by the GSI, and is printed on duodecimo (788 mm*1091 mm) paper. There are five colors that are used in these maps: gray, for the original topographic map; red and black, for the active faults; and orange and green for landform classification.
Sample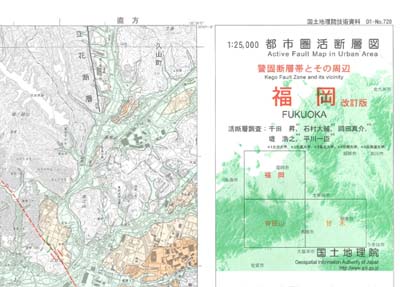
Active Fault Map (folded) (197mm*273mm) |