

The 2016 Taiwan Earthquake: Crustal deformation detected by ALOS-2 data
Crustal Deformation Observed by Synthetic Aperture Radar (SAR)Released: Mar. 3, 2016 Japanese version of this page Crustal Deformation revealed by InSARAn earthquake (Mw 6.4, USGS) occurred in Taiwan on February 5, 2016 (UTC). We applied interferometric analysis using ALOS-2/PALSAR-2 data to measure the crustal deformation caused by the earthquake.
The result obtained from the data acquired by February 18, 2016 is summarized as follows.
Note that the result is possibly updated with further elaborated analyses. InterferogramsClick the images below to enlarge.
 Fig. 1 [PNG: 912KB] 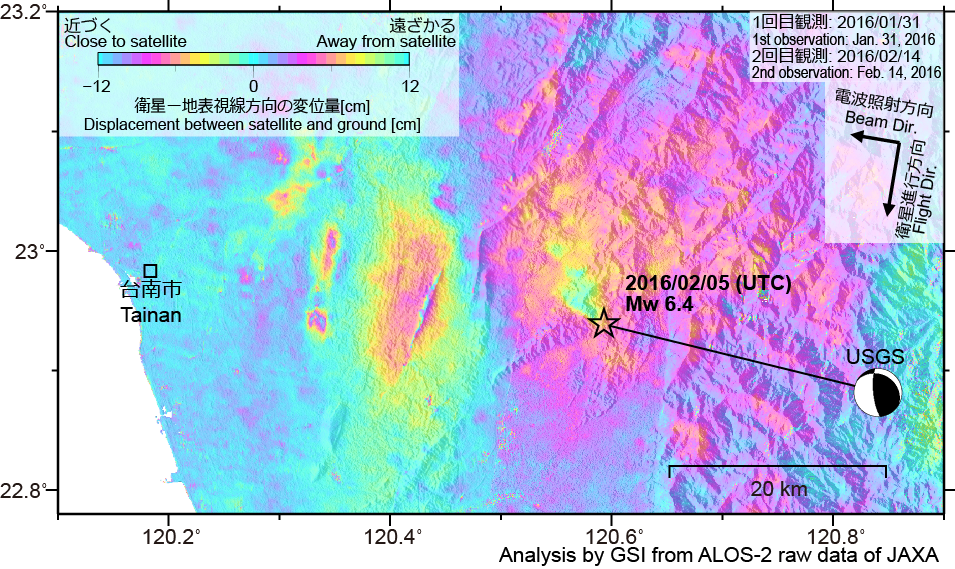 Fig. 2 [PNG: 925KB]
*1 F: Stripmap (Fine[10m]), W: ScanSAR (Normal) (cf. ALOS-2 Project / PALSAR-2 (JAXA)) Analized by GSI from ALOS-2 raw data of JAXA. These results were obtained through the activity of the SAR analysis working group of the Coordinating Committee for Earthquake Prediction. Quasi up-down and east-west components of displacementClick the images below to enlarge.
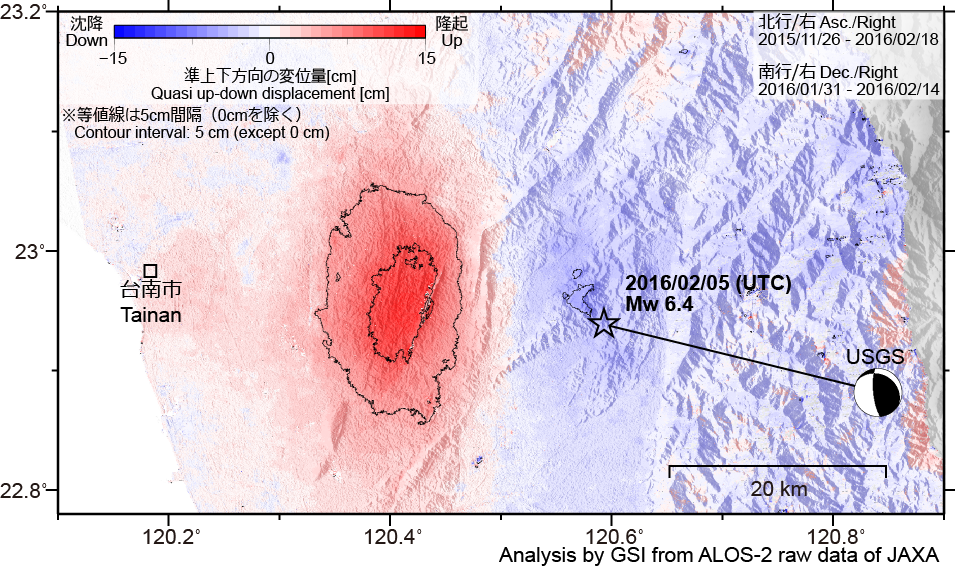 Fig. 3. Quasi up-down component [PNG: 792KB]  Fig. 4. Quasi east-west component [PNG: 823KB] 2.5-D analysis Two or more line-of-sight displacements with different observing directions can be decomposed to quasi up-down and east-west components. 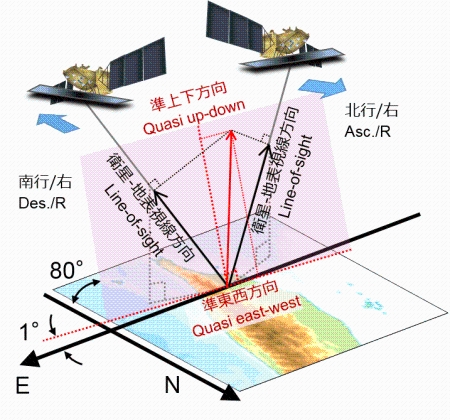 Fig. 5. Geometric relation of 2.5-D analysis The 2016 Taiwan Earthquake
SatelliteALOS-2 (Advanced Land Observing Satellite 2) launched by Japan Aerospace Exploration Agency on May 24, 2014
Paper, Report, PresentationIn preparation
Copyrights and CreditsCopyright. Geospatial Information Authority of Japan. ALL RIGHTS RESERVED.
We welcome links from your website to this website. When using materials on this website, we ask that proper credit be given. ContactYARAI Hiroshi : Head of Division
KOBAYASHI Tomokazu : Chief Researcher MORISHITA Yu : Researcher 
|